Figure 3.
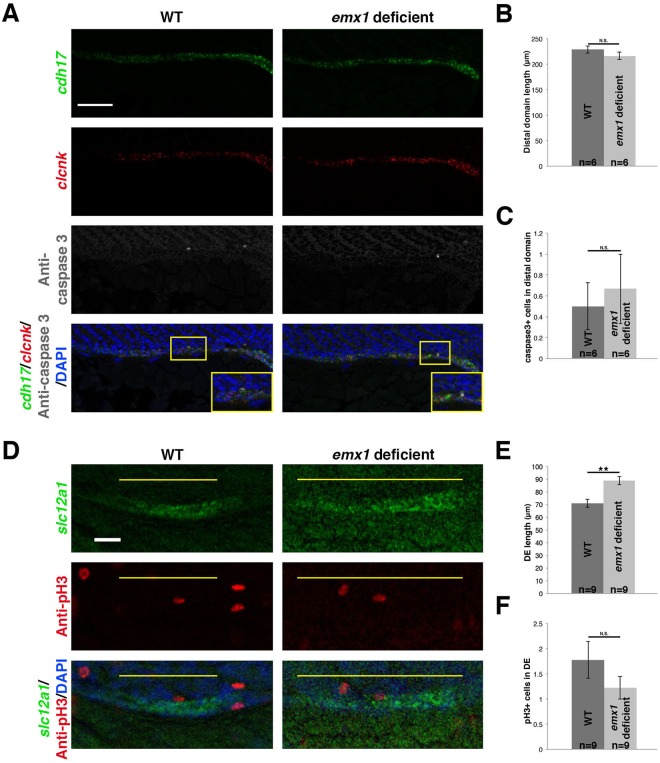
emx1 deficiency is not associated with changes in cell death or proliferation within the pronephros. (A) Confocal imaging of double FISH analysis (lateral view) of 28 ss WT and emx1 deficient embryos for the renal epithelial cell marker cdh17 (green), the pan-distal segment marker clcnk (red), combined with protein localization of active caspase-3 (grey) and DAPI staining (blue) through IHC. Yellow boxes demarcate areas shown in insets. Scale bar = 50 μm. (B,C) Quantification of caspase-3+ cell number and clcnk domain. (D) Confocal imaging of FISH analysis (lateral view) of 28 ss WT and emx1 deficient embryos for the DE marker slc12a1 (green), with protein localization of pH3 (red) and DAPI (blue) using IF. Yellow lines demarcate the DE domain. Scale bar = 20 μm. (E,F) Quantification of pH3+ cells in the DE and average DE length. **p < 0.01; N.S. = not significant. Error bars indicate standard error.

