Figure 5.
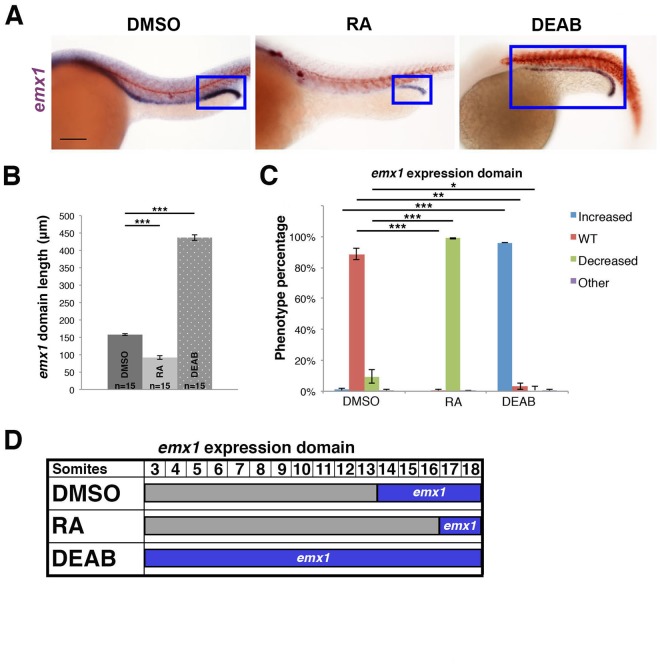
emx1 expression within the pronephros is negatively regulated by RA signaling. (A) WISH panel (lateral view) of emx1 expression in 28 ss embryos treated with DMSO vehicle, all-trans RA, or DEAB. Blue boxes demarcate domains of emx1 expression in the pronephros. Scale bar = 100 μm. (B) Quantification of the emx1 expression domain in DMSO, RA, and DEAB treated embryos. (C) Quantification of phenotypes, categorized as increased, WT, decreased, or other, where the latter include those developmentally delayed or too dysmorphic to measure. (D) Summary of the emx1 expression domain in treatment groups. *p < 0.05; **p < 0.01; ***p < 0.001. N.S. = not significant. Error bars represent standard error.

