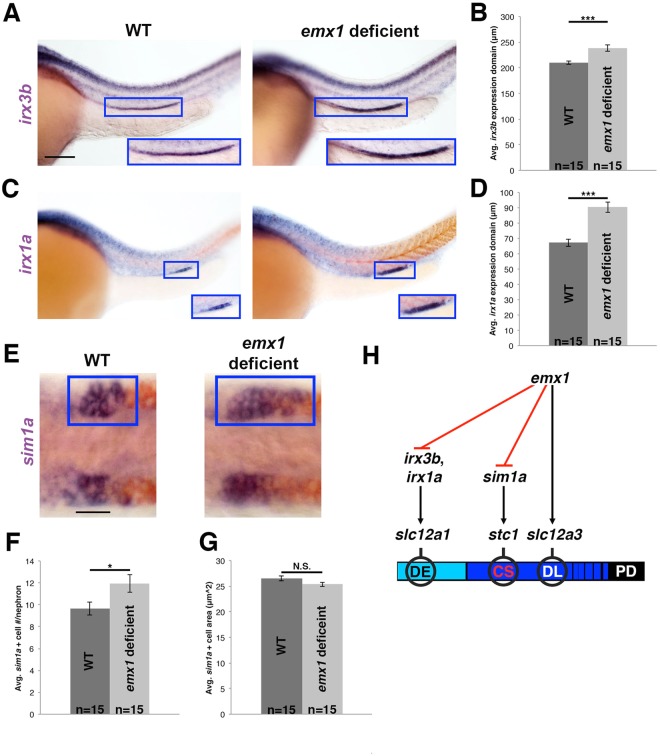
Figure 9.
emx1 deficiency results in increased irx3b, irx1a, and sim1a expression domains. (A) WISH (lateral view) of 28 ss WT and emx1 deficient embryos for irx3b (purple). (B) Quantification of irx3b domain length. (C) WISH (lateral view) of 28 ss WT and emx1 deficient embryos for irx1a (purple) and smyhc1 (red). (A,C) Blue boxes demarcate domains of pronephros expression. Scale bar = 100 μm. (D) Quantification of irx1a domain length. (E) WISH (dorsal view) of 28 ss WT and emx1 deficient embryos for sim1a (purple) and slc12a3 (red). Blue boxes demarcate a single CS territory while the contralateral side is unlabeled. Scale bar = 20 μm. (F,G) Quantification of sim1a+ cell number and size. *p < 0.05; ***p < 0.001; N.S. = not significant. Error bars represent standard error. (H) emx1 restricts formation of the DE by inhibiting expression of irx3b and irx1a, restricts the CS anlage by inhibiting sim1a expression, and promotes DL fate (slc12a3+) by regulating unknown targets.

