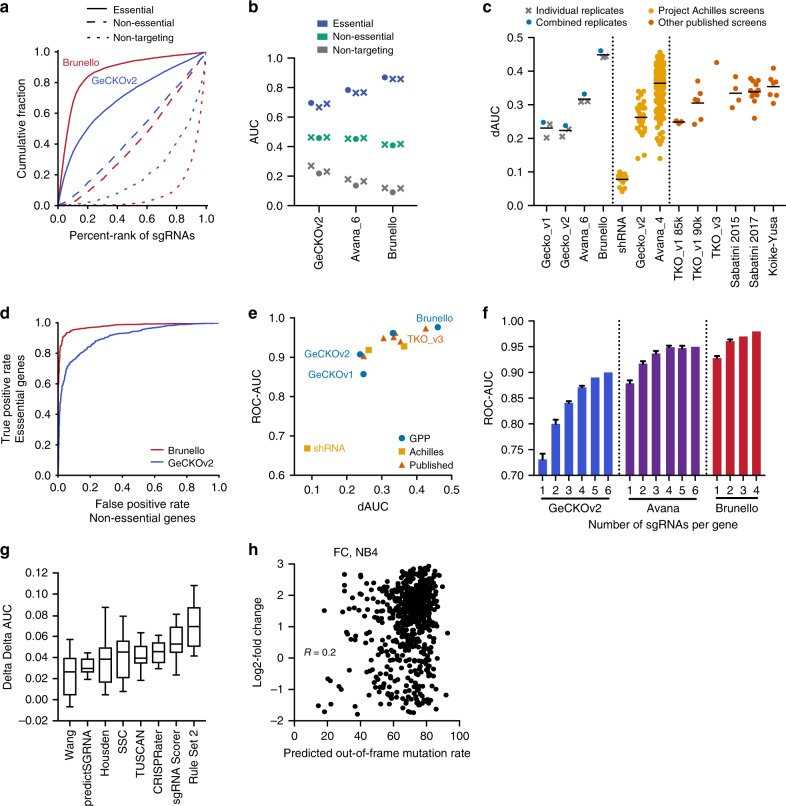
Fig. 1.
Improved performance of genome-wide CRISPRko libraries. a Area under the curve analysis of cell viability screens for core essential (solid line), non-essential (dashed line), and non-targeting (dotted line) gene sets in the Brunello and GeCKOv2 library screened in A375 cells. b Comparison of AUCs for essential, non-essential, and non-targeting sgRNAs across the generations of libraries screened by this group. The AUC of individual replicates are plotted as X’s, while the AUC values calculated from the averaged log2-fold change of the replicates are plotted as circular points. The Avana library was screened with 6 sgRNAs per gene. c Comparison of the dAUC across different CRISPRko libraries. All published libraries are plotted as circular points from the combination of replicates, if provided. Black line represents the average of the dAUCs. For Project Achilles, a version of the Avana library with 4 sgRNAs per gene was used; the shRNA data are shown for the same 33 cell lines that were screened with GeCKOv2. d Receiver operating characteristic analysis of cell viability screening data for the Brunello and GeCKOv2 libraries screened in A375 cells. False positive rates are determined by non-essential genes and plotted against the true positive rate, determined by essential genes. e Comparison of the dAUC and ROC-AUC values for different libraries; when multiple cell lines of data were available, the mean is plotted. GPP refers to screens described here and previously by this group. f Subsampling analysis calculating the ROC-AUC of n sgRNAs per gene in three different libraries. Error bars represent s.d. calculated from different iterations of library sampling. g Difference in the dAUC (ddAUC) for various scoring schemes when applied to the 33 cell lines screened with GeCKOv2. The box represents the 25th, 50th, and 75th percentiles; whiskers show 10th and 90th percentiles. h Comparison of the predicted out-of-frame mutation rate to the previously measured log2-fold change of sgRNAs in the flow cytometry (FC) dataset targeting cell surface genes in the NB4 cell line

