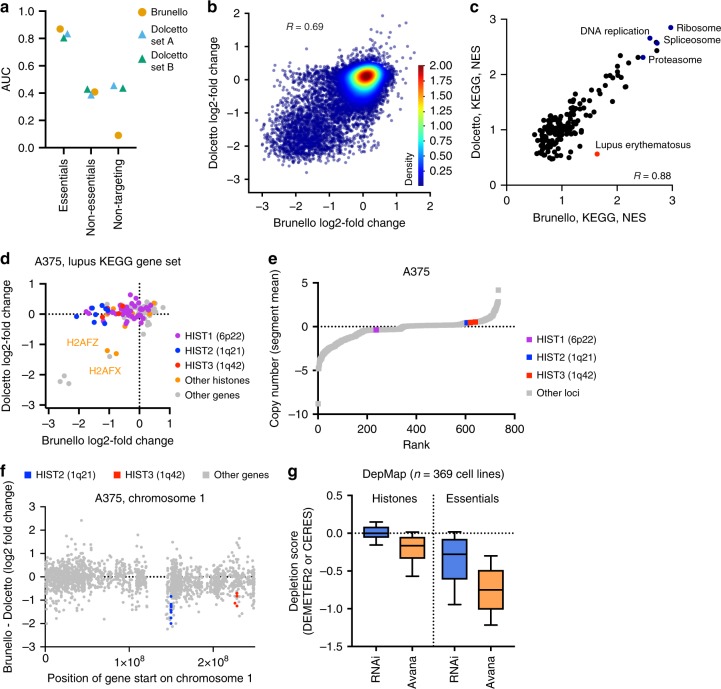
Fig. 4.
Comparison of CRISPRko and CRISPRi. a Comparison of AUCs for essential, non-essential and non-targeting sgRNAs across CRISPRko and CRISPRi libraries screened in A375 cells. CRISPRko is plotted as circular points and CRISPRi is plotted as triangles. b Comparison of the log2-fold change of genes in Brunello and Dolcetto (average of Sets A and B). Pearson correlation is reported. c Scatter plot comparing the GSEA normalized enrichment scores (NES) for KEGG genes sets for Brunello and Dolcetto. Selected gene sets are annotated. d Scatter plot comparing log2-fold change of genes from the KEGG Systemic Lupus Erythematosus gene set for Brunello and Dolcetto in A375 cells. Histone genes are colored based on their chromosomal location. e Segmented copy number (segment mean; log2-fold change from average) of genetic loci in A375 cells. f Position of gene start along chromosome 1 compared to the difference in log2-fold change between Brunello and Dolcetto in A375 cells. g Depletion of histone genes and essential genes in data from the Project Achilles screens in 369 cell lines screened with both RNAi and CRISPR (Avana library). The box represents the 25th, 50th, and 75th percentiles; whiskers show 10th and 90th percentiles

