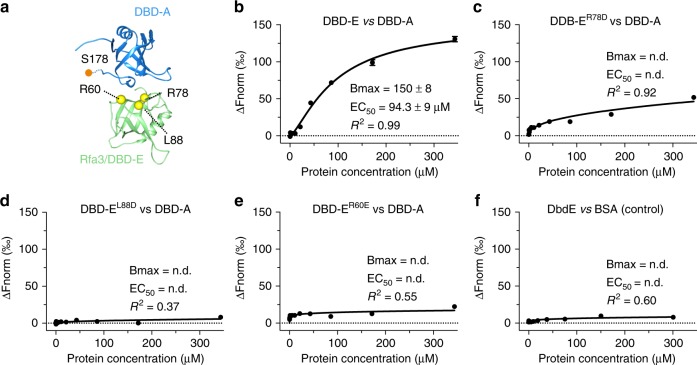
Fig. 5.
Investigation of the DBD-A–DBD-E interaction. a A proposed model for the interaction between Rfa1-DBD-A (blue) and Rfa3 (green) based upon the interaction interface between Ustilago maydis DBD-A and Rfa3 in the crystal structure asymmetric unit. The model was created using the yeast DBD-A NMR structure (pdb 1ynx) and the refined Rfa3 model from our cryo-EM data, superposed onto DBD-A and Rfa3 of pdb 4gop. Residues R78, L88, and R60 that we mutate in this study are located at the interface and are illustrated by yellow spheres. A Mec1-dependent DBD-A phosphorylation site (S178) close to the interaction interface is labeled. b–e Microscale thermophoresis (MST)-binding curves using purified DBD-A versus fluorescently labeled Rfa3-OB domain (residues 1–99) together with binding curves for the Rfa3-OB point mutants (substitutions given above curves). Normalized fluorescence was calculated using NanoTemper Analysis 1.2.101 and is plotted as function of DBD-A concentration. The apparent effective half maximal binding (EC50) was calculated by fitting using the hill equation in Prism and is given for each binding experiment together with the calculated maximum fluorescence (Bmax) and R2 of the fit. n.d. denotes not determined. f Bovine serum albumin (BSA) control for non-specific binding is also shown. Each experiment was performed in triplicate with each data point an average with standard error of the mean (SEM) shown. Source data are provided as a Source Data file

