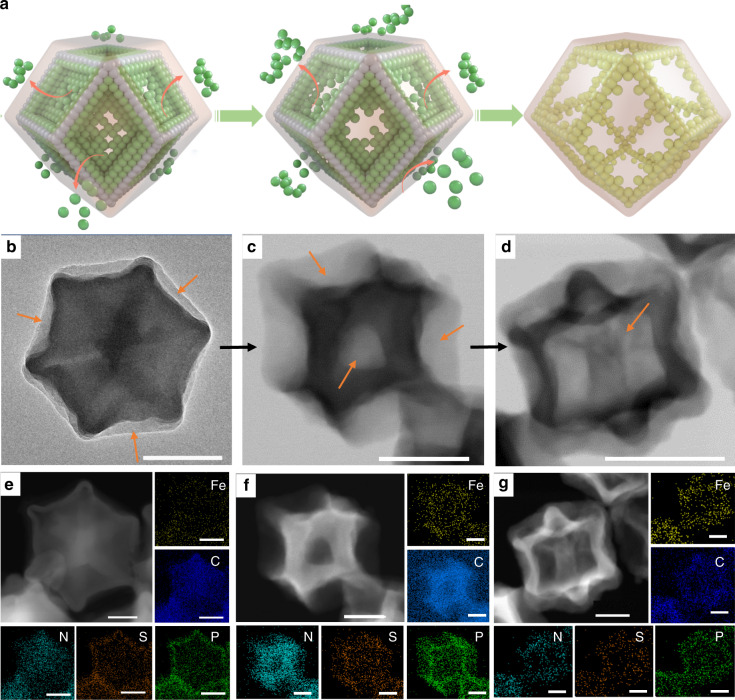
Fig. 2.
The formation process of functionalized hollow structure. a Schematic illustration of evolutionary trajectory of hollow structure. b–d Transmission electron microscopy (TEM) images, scale bar, 200 nm; and e–g the corresponding energy-dispersive spectroscopy (EDS) element maps (Fe: yellow, C: blue, N: cyan, S: orange, P: green) at different pyrolysis temperatures of 400, 500, and 600 °C for 30 min with a heating rate of 5 °C min−1 under flowing Ar atmosphere, respectively, scale bar: 100 nm

