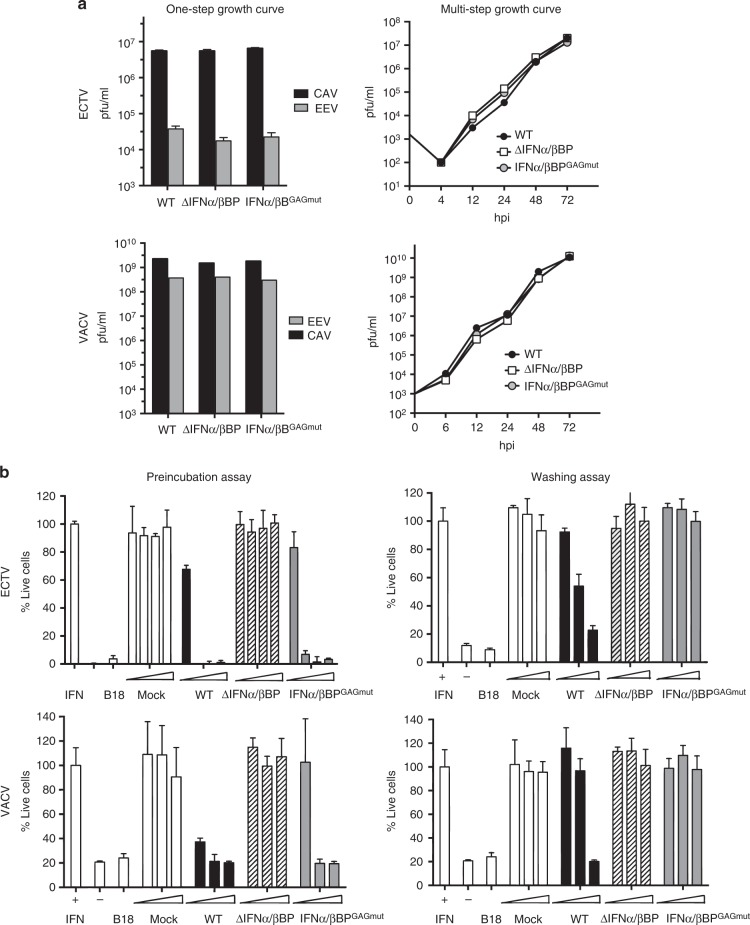
Fig. 3.
Characterisation of mutant viruses in cell culture. a BSC-1 cells were infected with the indicated viruses at 0.01 pfu/cell for multi-step growth curves or 5 pfu/cell for one-step growth curves. Total virus production was determined by plaque assay at the indicated times in the multi-step growth curve. Virus titres at 24 hpi from fractions containing cell associated viruses (CAV) or extracellular viruses (EV) where determined in the one step growth curves. b Detection of IFN-I blocking activity in supernatants from recombinant ECTV (upper graphs) or VACV (lower graphs) infected cells was performed using the previously described preincubation (left) or washing (right) assays. In both assays, controls of untreated (IFN -) or IFN-I treated cells (IFN + ) and also B18 recombinant protein were incorporated as positive control. Data are means showing standard deviations of two independent experiments performed in triplicate

