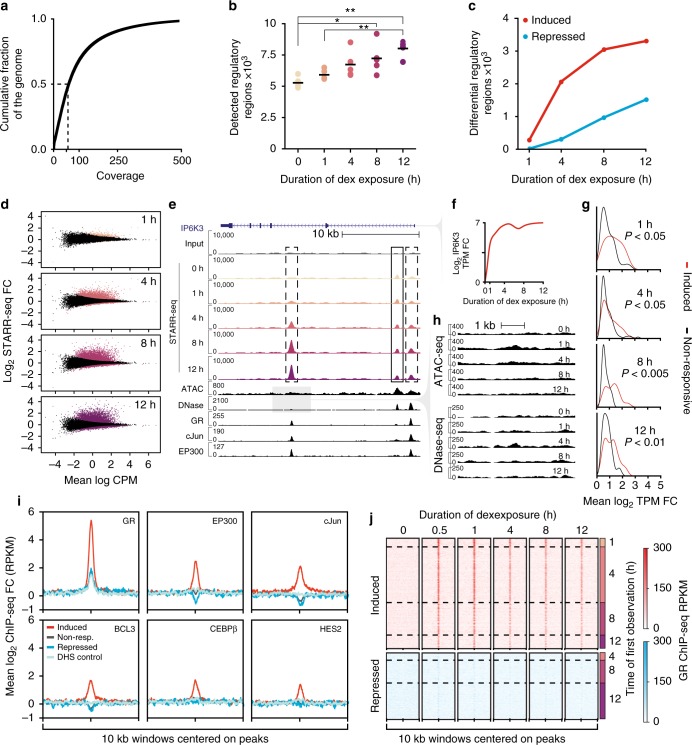
Fig. 2.
Genome-wide high-throughput reporter assays measure environmentally responsive regulatory element activity. a Cumulative distribution of coverage for the whole-genome STARR-seq library. The median per base coverage is 59× (dashed line). b The number of regulatory regions identified by STARR-seq in each replicate increased with longer dex exposure (one way ANOVA followed by Tukey’s multiple comparison test; *P < 0.05, **P < 0.01). c The number of called DREs (FDR <5%). d Distribution of regulatory responses to dex. The fold change in reporter activity for all regulatory regions is plotted as a function of the mean sequencing coverage at that region. Significant responses are colored by time point. e Induced (dashed boxes) and steady-state (solid box) regulatory regions detected by whole-genome reporter assays correspond to epigenomic features identified by complimentary genomic assays at the dex-induced IP6K3 locus. STARR-seq input library coverage is displayed in the top track. ATAC-seq, DNase-seq, and ChIP-seq data after 4 h of dex treatment. f IP6K3 RNA-seq was measured in transcripts per milion (TPM). g GC-responsive gene induction is greater in TADs containing induced DREs compared to TADs containing non-responsive regulatory elements. The distribution of mean fold changes for all differentially induced genes in the same TAD is plotted for all TADs containing an induced DRE or non-responsive regulatory element in DHS. Median fold changes were compared with the Mann–Whitney U test. h Chromatin accessibility tracks for the 5 kb window centered on the upstream TF-bound induced DRE displayed in e (gray box). i Aggregate profile plots of the mean fold changes in post-dex ChIP-seq signal across 10 kb windows centered on DHS+ regulatory element midpoints. Induced (n = 1646) and repressed (n = 746) DREs are shown in red and blue, respectively. Non-responsive regulatory regions (n = 6531) are displayed in gray and control regions (n = 1646) are shown in pale blue. Control regions are randomly selected 520 bp (median STARR-seq regions length) regions filtered to matched to DHS+ induced DRE accessibility. j Heatmaps showing the average GR ChIP-seq signal in 10 kb windows centered on all dynamic DRE midpoints. Rows are grouped according to the time point for which the DRE was first called significant

