Fig. 1.
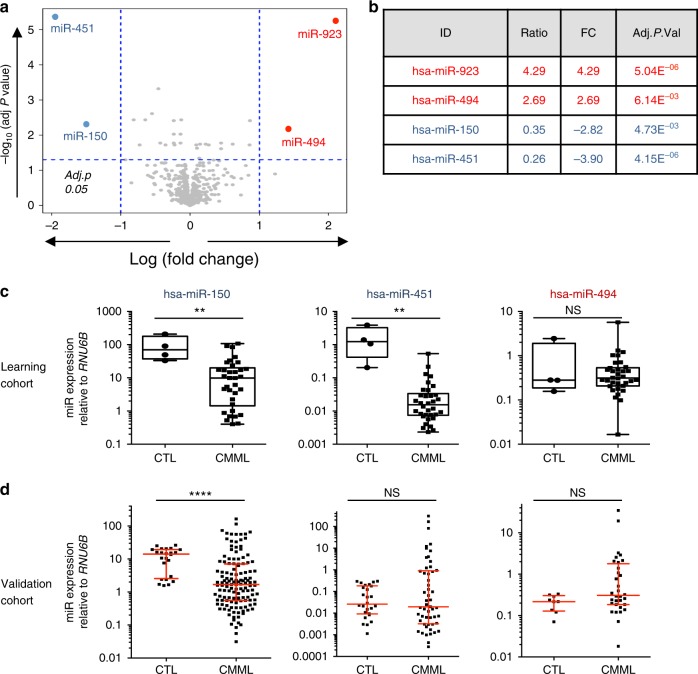
Differentially expressed miRNA from control and CMML patient-sorted CD14+. a Volcano plot showing the differentially expressed miRNAs in CD14+ cell-sorted monocytes from CMML (n = 33) and healthy donor (n = 5 + pool of five samples) peripheral blood samples (learning cohort), as measured using v12.0 Agilent microarray. X-axis, log 2 fold-change value; Y-axis, −log 10 (adjusted P value). b List of the four miRNAs identified as deregulated in the learning cohort. Of note, hsa-miR-923 up-regulation is a known artifact of the v12.0 version of these microarrays. c Box plot showing the relative expression of hsa-miR-150, hsa-miR-451, and hsa-miR-494 analyzed by qRT-PCR in samples of the learning cohort (center line: median; whiskers: min to max). d qRT-PCR analysis of the relative expression levels of hsa-miR-150 (CTL = 24; CMML = 133), hsa-miR-451 (CTL = 24, CMML = 53) and hsa-miR-494 (CTL = 9; CMML = 32) in an independent validation cohort. Red lines, median with interquartile range; Mann–Whitney test: **P < 0.01; ****P < 0.0001. NS nonsignificant

