Fig. 4.

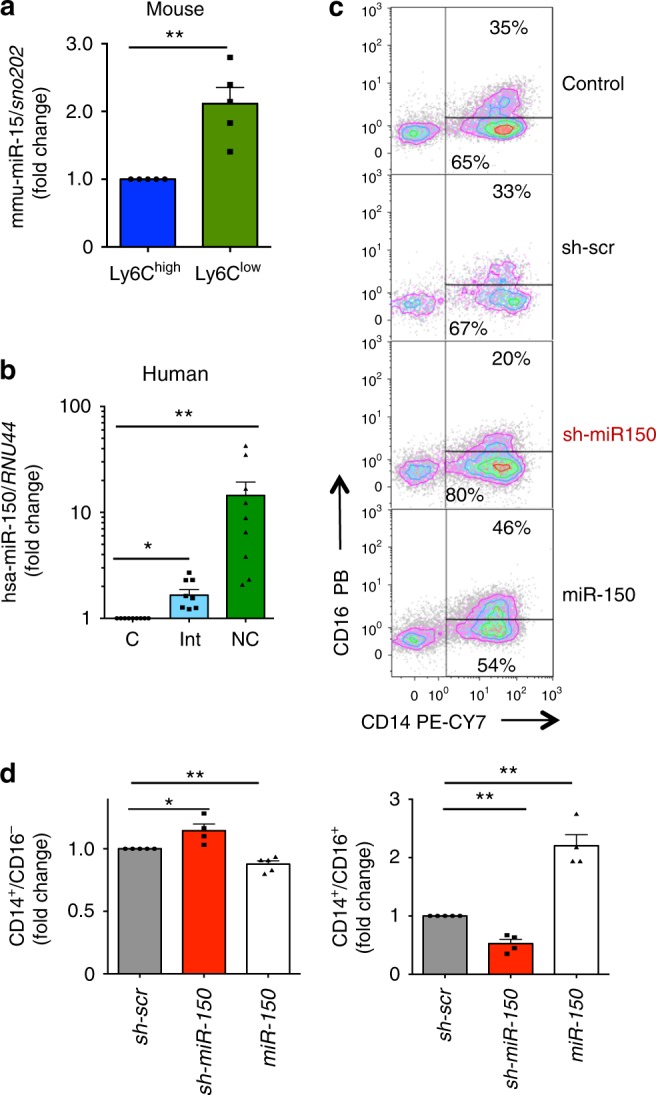
Differential expression of miR-150 in human and mouse monocyte subsets. a qRT-PCR analysis of mmu-miR-150 expression normalized to sno202 in Ly6Clow compared to Ly6Chigh monocytes sorted from wild-type mice peripheral blood. Results are expressed as fold-change relative to Ly6Chigh monocytes. Mean ± SEM of five independent experiments, paired t test, **P < 0.01. b qRT-PCR analysis of hsa-miR-150 expression normalized to RNU-44 in peripheral blood classical (C), intermediate (Int), and nonclassical (NC) monocytes sorted from peripheral blood samples of nine healthy donor controls. Results are expressed as fold-change relative to classical monocytes. Mean ± SEM; paired t test, *P < 0.05; **P < 0.01. c, d Sorted CD34+ cells were not transduced (control) or transduced with vectors expressing the GFP and a control shRNA (Sh-SCR) or a shRNA targeting hsa-miR-150 (sh-miR-150) or hsa-miR-150 (miR-150), and then cultured in liquid medium for 7 days in the presence of SCF and M-CSF before flow cytometry analysis of generated monocyte subsets, based on CD14 and CD16 expression. c shows a representative flow cytometry analysis. d shows the fraction of CD14+CD16− (left panel) and CD14+CD16+ (right panel) generated by CD34+ cells with decreased (sh-miR-150) or increased (miR-150) hsa-miR-150 level relative to controls (sh-scr). Mean ± SEM of four independent experiments, paired t test, *P < 0.05; **P < 0.01
