Fig. 5.
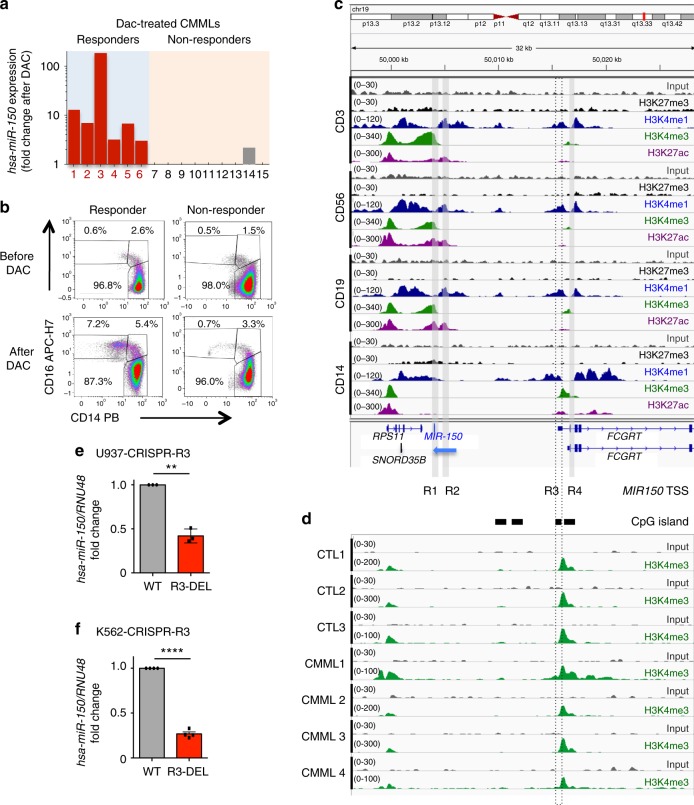
Regulation of hsa-miR-150 expression by a monocytic lineage-specific promoter. a Expression of hsa-miR-150 (normalized to RNU-6B) in monocytes of 15 CMML patients according to their response to three to six cycles of decitabine (DAC). Results are expressed as hsa-miR-150 expression fold-change after versus before treatment. b Representative dot plots showing the monocyte subset repartition before and after treatment with decitabine (DAC) in a responder and a non-responder CMML patient. c Input (gray, scale 0–30) and ChIP-seq data for H3K27me3 (black, scale 0–30), H3K4me1 (blue, scale 0–120), H3K4me3 (green, scale 0–340) and H3K27ac (purple, 0–300) obtained in human CD3+, CD19+, CD56+, and CD14+ cells were collected from www.roadmapepigenomics.org/. miR-150 promoters are indicated as R1, R2, R3, and R4. Black rectangles indicate CpG islands. MIR150 gene (blue) is on DNA minus strand (blue arrow), while other genes (in black) are on the DNA plus strand. d Input (gray) and ChIP-seq of H3K4me3 (green) in sorted CD14+ cells collected from three healthy donors (CTL) and four CMML patients. Data are shown as normalized Bigwig. Scales are on the left. e, f Expression of hsa-miR-150 (normalized to RNU-48) in U937 (e) and K562 (f) clones in which R3 has been partially deleted using a CRISPR/Cas9 gene editing method. Results are expressed as hsa-miR-150 expression fold-change in R3-deleted clone (R3-DEL, red bars) relative to wild-type clone (WT, gray bars, normalized to 1). Results are mean ± SD of a minimum of three independent experiments. Paired t test, **P < 0.01; ****P < 0.0001

