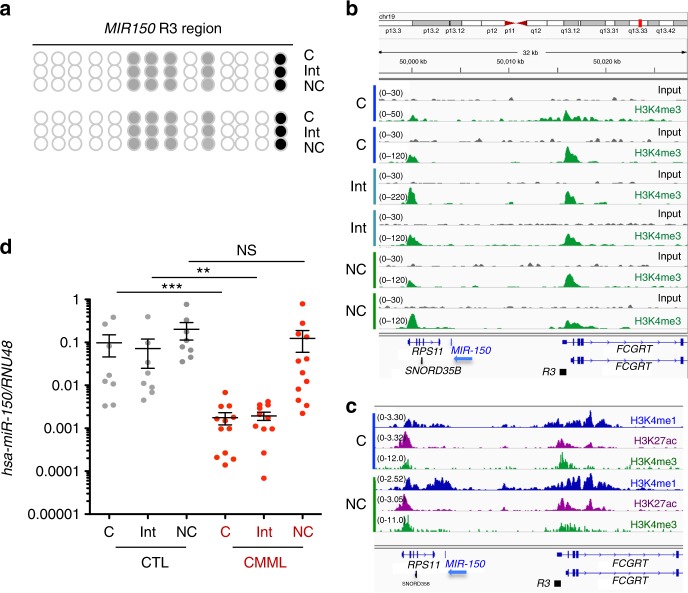
Fig. 7.
Methylation of MIR150 region 3 in human monocytes subsets. a DNA methylation of MIR150 region 3 (R3) was analyzed in classical (C), intermediate (Int), and nonclassical (NC) monocytes sorted from healthy donor peripheral blood samples. (Results of two healthy donors are shown.) White ball: no methylation; gray ball: methylated on one strand; black ball: methylated on two strands. b. Input and ChIP-seq of H3K4me3 in sorted classical (C), intermediate (Int), and nonclassical (NC) monocytes collected from two healthy donors. Data are shown as normalized Bigwig. R3 region is representated. c ChIP-seq data for H3K4me1 (blue) and H3K27ac (purple) collected from ref. 42 and for H3K4me3 (green), conducted in human classical (C) and nonclassical (Non-C) monocytes. R3 region is representated. d qRT-PCR analysis of hsa-miR-150 expression normalized to RNU-48 in classical (C), intermediate (Int), and nonclassical (NC) monocytes sorted from peripheral blood samples of 8 healthy donor controls (CTL) and 12 CMML patients. Mean ± SEM; Mann–Whitney test: **P < 0.01; ***P < 0.01. NS nonsignificant

