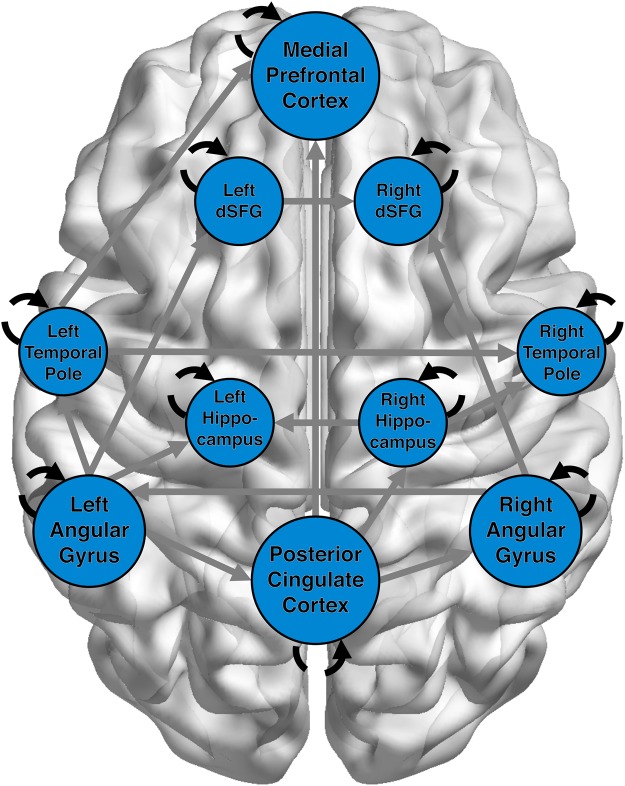
Figure 4.
DMN Network during Risk Decisions. DMN seed regions showed strong interconnectivity (grey), with hubs such as the left angular gyrus and posterior cingulate showing several cross-region connections. However, for the purpose of the current study, our main focus was the autoregressive paths (black) which are estimates of within-region stability in activation. Autoregressive paths are dashed to denote a lagged temporal relationship.

