Fig. 7.
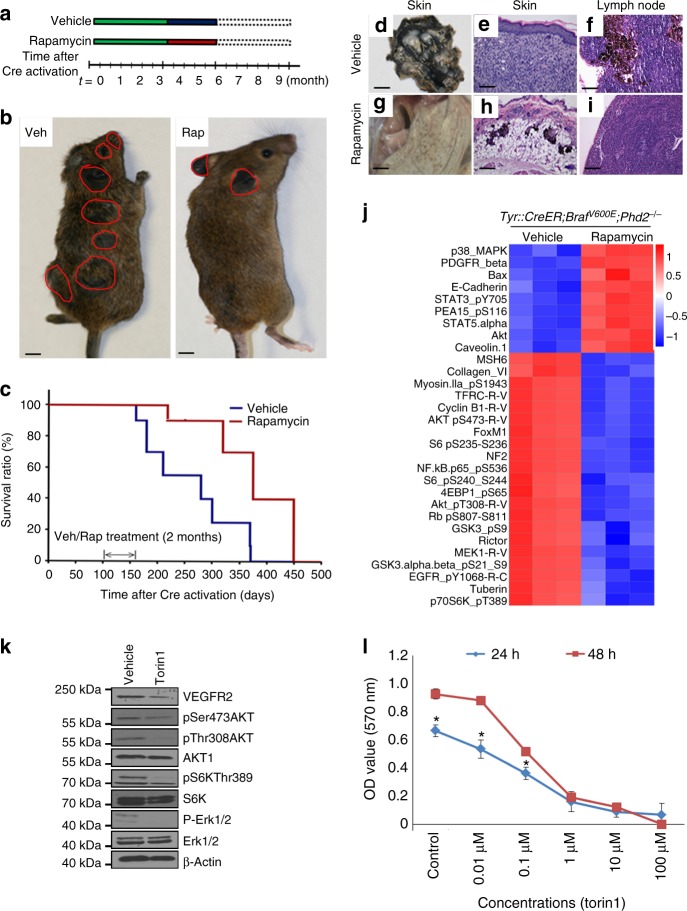
Inhibition of mTOR pathway suppresses the growth of melanoma in vivo. a Scheme of rapamycin treatment. b Representative images of Tyr::CreER; BRafV600E; Phd2−/− mouse treated with the vehicle control (left panel) or rapamycin (right panel). Rapamycin treatment lasted for 8 weeks. Tumor masses are highlighted by red circles. c Kaplan–Meier survival curves of mice treated with vehicle control (n = 10) or rapamycin (n = 10) and p < 0.05. d–i Representative images of skin and lymph nodes in mice treated with the vehicle control or rapamycin. After killing the mice, underside of skin was exposed and photographed (d, g). The entire dermis was occupied by tumor cells (e) and lymph node was positive for melanoma in the vehicle-treated mice (f). On the contrary, there were significantly fewer tumor cells in the dermis (h) with negative lymph node (i) in the rapamycin-treated mice. j Inhibition of the Akt–mTOR pathway resulted in tumor growth suppression. Tumor tissues with or without rapamycin treatment were processed and analyzed using RPPA assays. Proteins with most significant changes were used to generate the heatmap. Notably, phospho-RbS807/811, phospho-AKTS473, Cyclin B1, TFRC, phospho-S6S235/236, phospho-EGFRY1068, MEK1 and phospho-AKTT308 proteins were significantly reduced in mice treated with rapamycin. k Torin1 inhibits Akt–mTOR pathway. BRafV600E; Phd2−/− melanoma cells were treated with torin1 for 48 h. Western blot analysis was performed. Results are representative of three independent experiments. l Torin1 inhibits BRafV600E; Phd2−/− melanoma cell growth. The melanoma cells were treated with different concentrations of torin1 (Control, 0.01, 0.1, 1, 10 and 100 μM) and different lengths of time (24 or 48 h). Results are summary of three independent experiments. Bars in b indicate 6 mm. Bars in d, g indicate 3 mm. Bars in e, f, h, i indicate 100 µm. *p < 0.05 compared to control (t-test); error bars indicate s.d.

