Fig. 4.
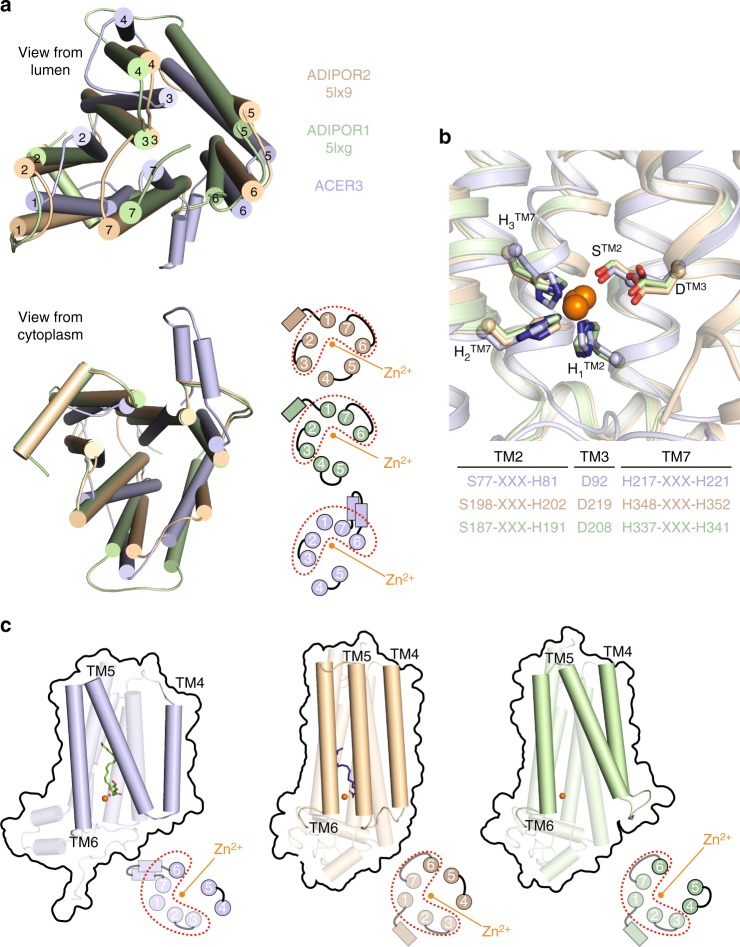
Comparison of ACER3 and ADIPORs structures. a Superposition of ADIPOR1 (light green), ADIPOR2 (dark yellow), and ACER3 (light blue) represented with cylindrical transmembrane helices viewed from the lumen (top) or from the cytoplasm (bottom). A scheme with numbered TMs is also shown at the bottom to highlight the similar architecture of TM1–3, 6, and 7. b Superposition of the three structures showing the strict structural conservation of the Zn2+ catalytic site of ACER3, ADIPOR2, and ADIPOR1 (colored as above). The primary sequence with the H3SD motif is also shown. c Views from within the membrane plane showing the differences in the architecture of TM4 and TM5 relative to the Zn2+ (orange sphere) between ACER3, ADIPOR2, and ADIPOR1 (colored as described above). The bottom scheme represents views from the cytoplasm, with the red dots highlighting the constant domain. This view also reveals the large TM4 and TM5 shift between the three structures

