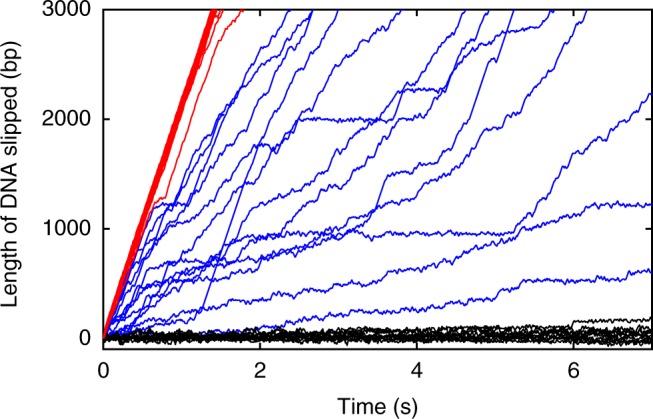
Fig. 2.

Measurements of DNA gripping by the motor and slipping. Representative measurements of length of DNA that slips out of the capsid vs. time with no nucleotides (red lines, average force = 3 pN), 0.5 mM γ-S-ATP (black lines, average force = 5 pN), or 0.5 mM ADP (blue lines, average force = 5 pN). Each line is a separate slipping event. Note that many red lines lie nearly on top of each other, and similarly for the black lines. The total numbers of solution exchange events and complexes measured for each condition, including ones not plotted here, are given in the results section of the text
