Fig. 3.
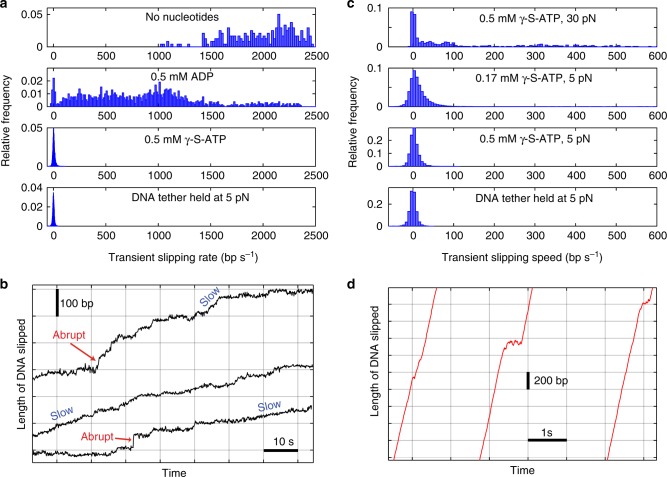
DNA slipping velocities and transient slipping events. a Distributions of slipping velocities measured in 1 s time intervals in the four different conditions indicated in the plot legends. “DNA tether held at 5 pN” indicates results from control experiments with fixed-length tethered DNA molecules (with no capsid motor complexes) to characterize transient non-zero velocities measured due to Brownian fluctuations and instrument noise. b Examples of different velocities of slipping (rare “abrupt” slips and more common “slow” slips) measured with 0.5 mM γ-S-ATP. Each plotted line is a single event, arbitrarily positioned on the graph, with length and time scales indicated by the scale bars. c Distributions of slipping velocities measured in 1 s time intervals for the four different conditions indicated in the plot legends. d Examples of brief decelerations during slipping which are observed infrequently in absence of nucleotides. Each plotted line is a single event, arbitrarily positioned on the graph, with length and time scales indicated by the scale bars

