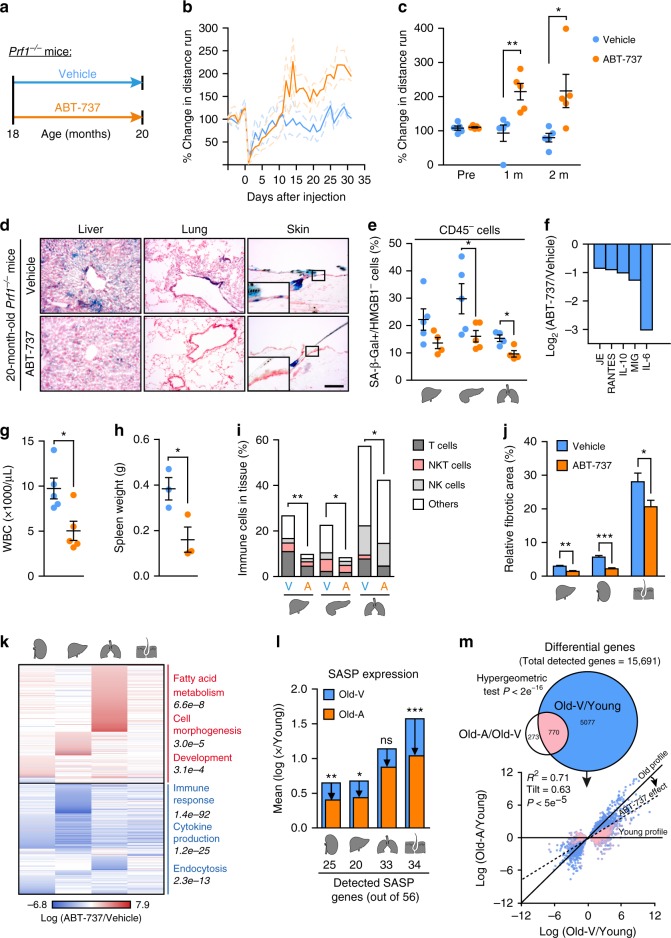
Fig. 4.
Treatment with ABT-737 counteract accelerated aging process of Prf1−/− male mice. a Starting from 18 months, ABT-737 or vehicle were administered to Prf1−/− mice at the beginning of each month, the mice were analyzed at the age of 20 months. b Change in distance run on a voluntary exercise test. Values are means and dashed lines represent ± SEM for each curve (n = 5 mice per group). c Average voluntary exercise levels during the last 3 days of the two months (n = 5 mice per group). d SA-β-Gal activity in indicated organs. Scale bar, 100 µm. (n = 5 mice per group). e CD45−/SA-β-Gal + /HMGB1− population in indicated organs (n ≥ 4 mice per group). f Relative cytokine levels in the serum for top five altered cytokines. Bars represent average intensity of 3 pooled samples. g WBC counts. (n = 5 mice per group). h Spleen weights. (n = 3 mice per group). i Flow-cytometry quantification of total immune cells (CD45+), T cells (CD45+/CD3+/NK1.1-), NKT cells (CD45+/CD3+/NK1.1+), and NK cells (CD45+/CD3-/NK1.1+) in indicated organs (n ≥ 4 mice per group). j Fibrotic areas in indicated organs based on the Sirius Red-stained sections in Supplementary Figure 6b. (n = 5 mice per group). Student’s t-test was used for all comparisons between Prf1−/− mice and WT mice. k Differentially expressed genes in indicated organs. Notable enriched GO terms are highlighted (n ≥ 3 mice per group). l SASP genes score, presented as expression mean log ratio of old ABT-737 and Vehicle treated over young Prf1−/− mice (Supplementary Figure 6c). The bottom panel depicts number of detected SASP genes. (n ≥ 3 mice per group). m Upper panel: Euler diagram of differentially expressed genes from all analyzed tissues. Lower panel: Log ratio of gene expression for 20-months-old ABT-737 (y axis) and Vehicle (x axis)-treated over young Prf1−/− mice. Dashed line represents linear regression fitted to the data; p value computed against the null hypothesis that tilt = 1; (n ≥ 3 mice per group). For all graphs, values are means ± SEM. Student’s t-test was used for all other comparisons. (*P < 0.05, **P < 0.01, ***P < 0.001)

