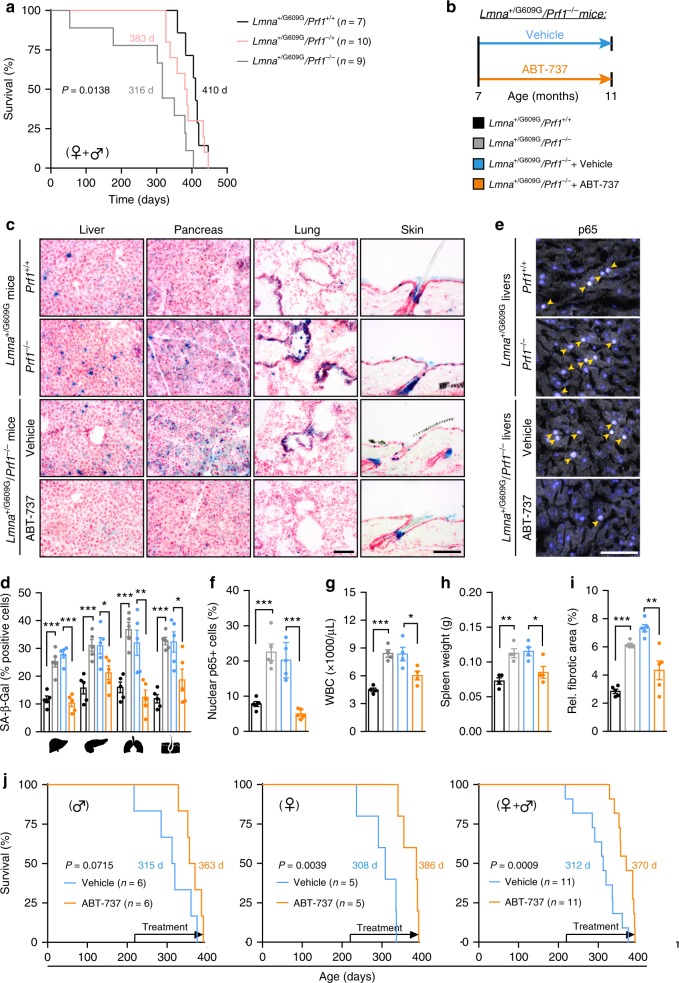
Fig. 6.
Treatment with ABT-737 increases median lifespan of progeroid mice with perforin deficiency. LMNA+/G609G/Prf1−/− mice, LMNA+/G609G/Prf1+/−, and LMNA+/G609G/Prf1+/+ mice from both genders underwent a survival test. a Kaplan–Meier curves of LMNA+/G609G/Prf1−/− mice, LMNA+/G609G/Prf1+/− mice and LMNA+/G609G/Prf1+/+ mice. Chi square Gehan–Breslow-Wilcoxon test was used for statistical analysis. Additional cohorts of LMNA+/G609G/Prf1+/+, LMNA+/G609G/Prf1−/−, ABT-737-treated and Vehicle-treated LMNA+/G609G/Prf1−/− female mice were raised. b Scheme of drug administration to LMNA+/G609G/Prf1−/− mice. Starting the age of 7 months ABT-737 or DMSO-based vehicle solution was administered to LMNA+/G609G/Prf1−/− female mice as described above. At the age of 11 months, mice from all groups were sacrificed and selected organs examined for the presence of senescent cells. c Representative images depicting SA-β-Gal activity in frozen sections of livers, pancreas, lungs, and skin from all groups of mice at the age of 11 months. Scale bar, 100 µm. d Percentage of SA-β-Gal + cells in livers, pancreas, lungs, and skin from all groups of mice. (n = 4 mice per group). e Representative images depicting immunofluorescence staining of p65 in livers from all mice groups. Scale bar, 100 µm. f Percentage of p65 + nuclei in livers from all groups. (n = 4 mice per group). g White blood cell counts of mice from all groups. (n = 4 mice per group). h Spleen weights of from all mice groups. (n = 4 mice per group). i Percentage of fibrotic area in livers paraffin-embedded sections of 11 month mice from all groups. (n = 4 mice per group). For all graphs, values are means ± SEM. Student’s t-test was used for all comparisons between mice groups. j Kaplan–Meier survival curves of ABT-737-treated and vehicle-treated LMNA+/G609G/Prf1−/− mice. Data is shown for males (n = 6), females (n = 5), and both genders combined (n = 11). Chi square Gehan–Breslow–Wilcoxon test was used for statistical analysis. (*P < 0.05, **P < 0.01, ***P < 0.001)

