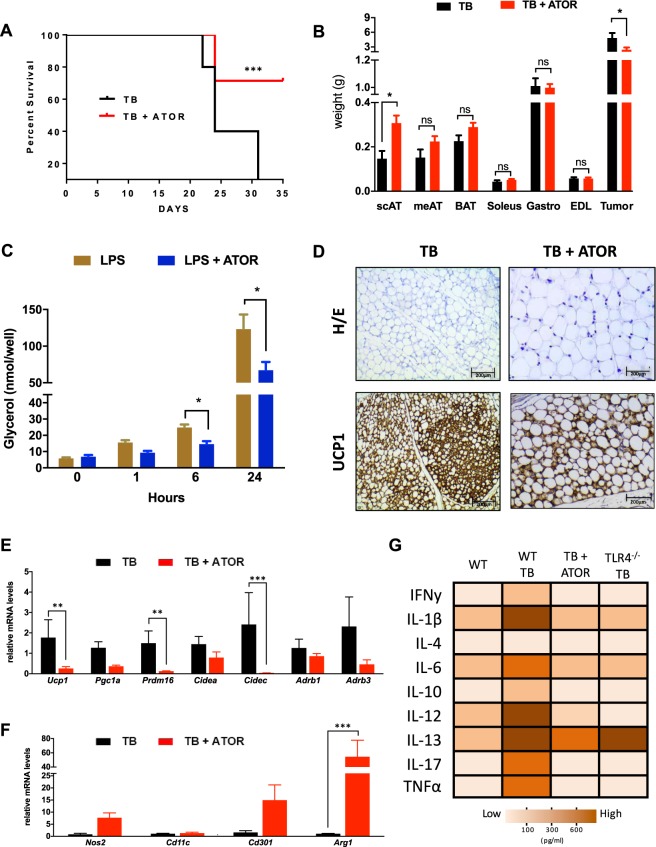
Figure 5.
Atorvastatin treatment increases survival and improved cachexia-remodeling in scAT. (A) Kaplan-Meier survival curves show a statistically significant difference (P < 0.05) in survival between the Tumor Bearing (TB) mice (N = 15 per group) and Tumor Bearing + ATOR treatment (TB + ATOR) mice (N = 15 per group). (B) Adipose tissue, muscle and tumor weights at study end. (C) Time course of lipolysis in 3T3-L1 induced by LPS (100 ng) and LPS + ATOR treatment (100 μM). (D) Immunohistochemical analysis for UCP1 in scAT. (E) qRT-PCR was performed for Ucp1, Pgc1a, Prdm16, Cidea, Cidec, Adrb1 and Adrb3 (F) Nos2, Cd11c, Cd301 and Arg1 (M1 and M2 macrophage polarization markers) for mRNA quantification in scAT from the different groups. N = 5 per group. (G) Heat map representing the circulating pro-inflammatory cytokines in the serum from the different experimental groups. White to brown scale depicts cytokine levels in pg/ml. Data were analyzed using the Bio-Plex manager software. N = 8 per group. Scale bars, 200 μm. Graph show the mean ± SEM. Significant differences were determined using Student’s t-test (B,E,F) and two-way ANOVA (C). Subcutaneous AT (scAT); Mesenteric AT (meAT); Brown AT (BAT); Extensor Digitorum Longus Muscle (EDL). *P < 0.05; **P < 0.01; ***P < 0.001.

