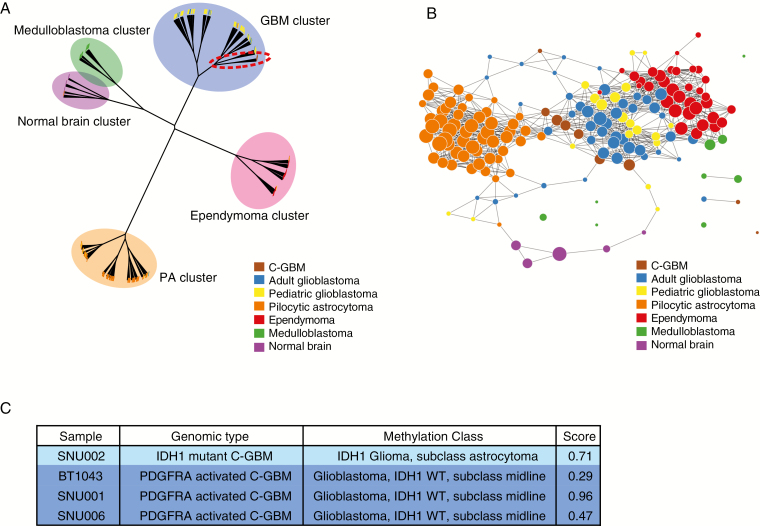
Fig. 3.
Global transcriptomic and methylomic patterns of C-GBMs. (A) Hierarchical clustering tree of C-GBMs with normal brains and multiple brain tumors based on mRNA expression levels. Samples were clustered by diseases, and C-GBMs were gathered with adult and pediatric GBM in the GBM cluster. (B) A topological data analysis of C-GBMs with normal brain and multiple brain tumor samples. C-GBMs were close to adult GBMs. (C) Methylation classification of C-GBMs based on calibrated score. The classification results are provided by MolecularNeuropathology.org.

