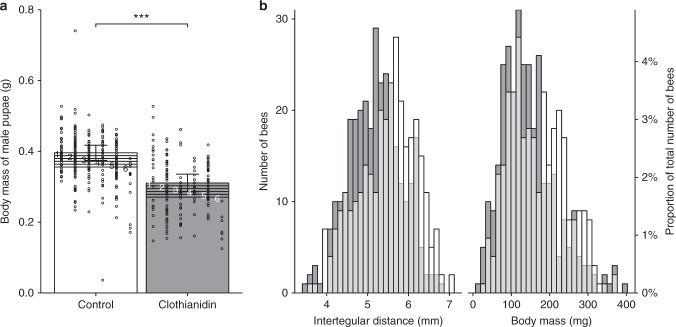
Fig. 2.
Size of pupae and adult bumblebees. a Body mass of male pupae in relation to treatment (control or clothianidin seed coating) and pupal developmental stage (1–6). Error bars represent 95% profile confidence intervals of linear mixed-effects model estimates at the earliest developmental stage (1). Circles indicate raw data on measured body mass (per bee). ***P < 0.001. P-values were calculated by likelihood ratio tests on a linear mixed-effects model. b Histograms of the intertegular distance and the body mass of adult worker bumblebees from colonies (32 per treatment) placed in oilseed rape fields (8 per treatment) sown from clothianidin-treated (dark grey; n = 320 bees) or insecticide-free seeds (white; n = 313). Overlaps between the two treatment groups are shown in light grey and values are expressed in absolute terms and percentages of the total number of measured bees

