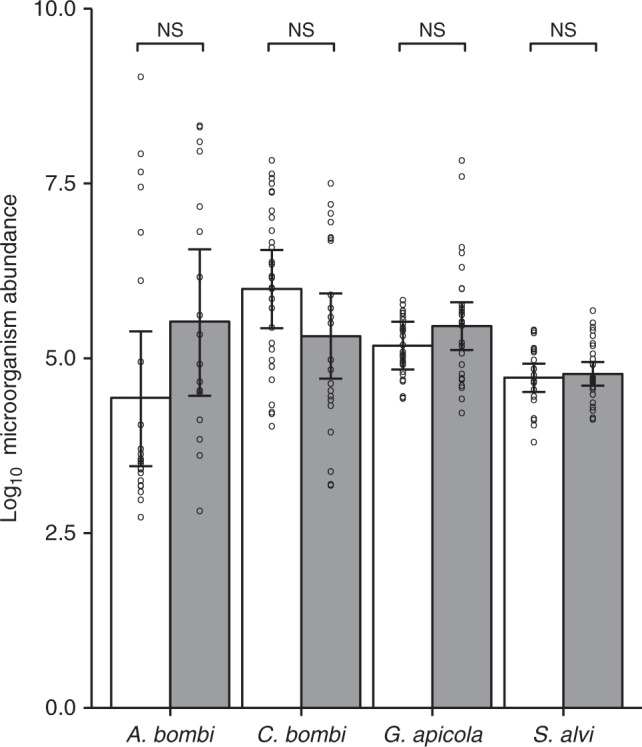
Fig. 4.

Microorganism abundance. The log10 DNA copy numbers per bee and colony of the most frequently detected microorganisms (Apicystis bombi (n = 40 colonies in N = 15 fields), Crithidia bombi (n = 53, N = 16), Gilliamella apicola (n = 58, N = 16), Snodgrassella alvi (n = 50, N = 16)) in relation to treatment (white, control; grey, clothianidin seed coating) in oilseed rape fields (8 per treatment). The error bars represent 95% profile confidence intervals of linear mixed-effects model estimates. Circles indicate measured values (per colony). NS not significant (P > 0.05). P-values were calculated by likelihood ratio tests on linear mixed-effects models
