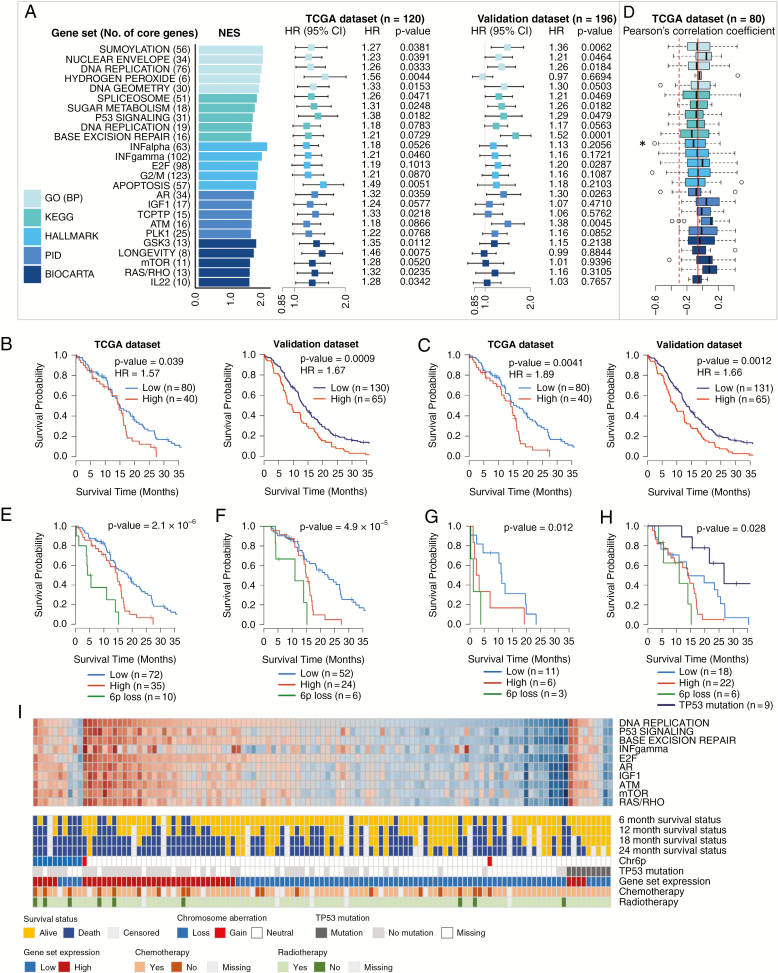
Fig. 2.
Identification and validation of prognostic gene sets, chromosome aberrations, and mutations in the classical subtype. (A) Top 5 prognostic gene sets in 5 terms and forest plots of HRs per 0.1 increment of average relative expression with 95% CIs from Cox regression. (B) Kaplan–Meier plots with log-rank tests of high/low expression groups divided by the upper tertile cutoff (66.7%) of the average expression of 148 core genes in the top 3 GO gene sets. (C) Kaplan–Meier plots with log-rank tests of high/low expression groups divided by the upper tertile cutoff of the average expression of 76 core genes in the “DNA replication” gene set. (D) Boxplots of Pearson’s correlation coefficients calculated with expression profiles and β-values of CpG methylation probe of core genes. (E) Kaplan–Meier plots with log-rank tests of 3 groups: the 6p loss group and 2 expression groups defined in (C) without 6p loss. (F) Kaplan–Meier plots with log-rank tests of 3 groups defined in (E) but confined to the patients with chemotherapy and radiotherapy. (G) Kaplan–Meier plots with log-rank tests of 3 groups defined in (E) but confined to the patients without either chemotherapy or radiotherapy. (H) Kaplan–Meier plots with log-rank tests of 4 groups, a group with TP53 mutation and 3 groups defined in (E). (I) Heatmap of the average expression of core genes in 10 representative gene sets with 6- to 24-month survival statuses, 6p status (Chr6p), TP53 mutations, expression categories defined in (C), and treatment information. *P < 0.05.

