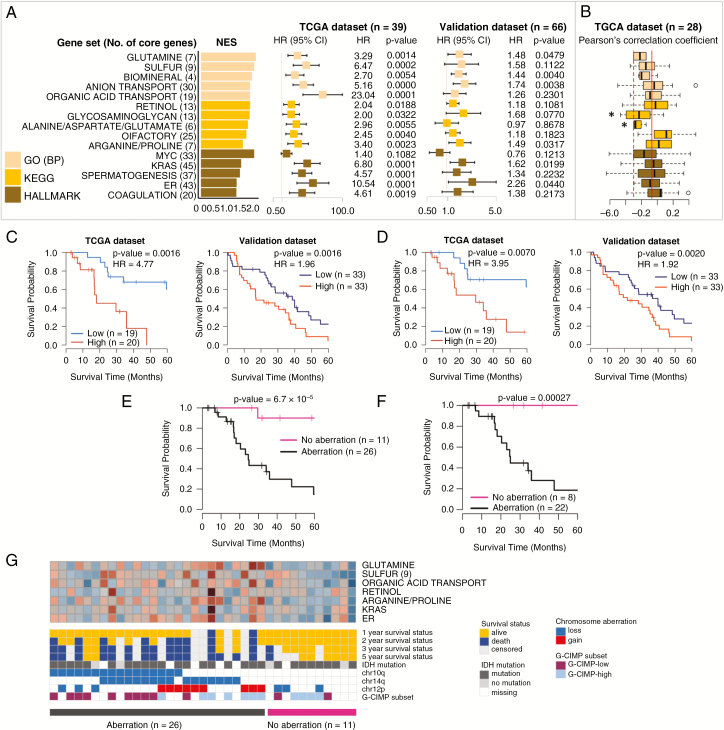
Fig. 4.
Identification and validation of prognostic gene sets and chromosome aberrations in the G-CIMP subtype. (A) Top 5 prognostic gene sets in 3 terms and forest plots of HRs per 0.1 increment of average relative expression with 95% CIs from Cox regression. (B) Boxplots of Pearson’s correlation coefficients calculated between expression profiles and β-values of the CpG methylation probe of the core genes. (C) Kaplan–Meier plots with log-rank tests of high/low expression groups divided by the median average expression of 20 core genes in the top 3 GO gene sets. (D) Kaplan–Meier plots with log-rank tests of high/low expression groups divided by the median average expression of 9 core genes in the “Sulfur” gene set. (E) Kaplan–Meier plots with log-rank tests of 2 groups divided by the presence or absence of 10q loss, 14q loss, and 12p gain. (F) Kaplan–Meier plots with log-rank tests of 2 groups defined in (E) but confined to the patients with chemotherapy and radiotherapy. (G) Heatmap of the average expression of core genes in 7 representative gene sets with 1–3 and 5-year survival statuses, chromosome aberrations, IDH1 mutation, and G-CIMP subsets divided by methylation status. *P < 0.05.

