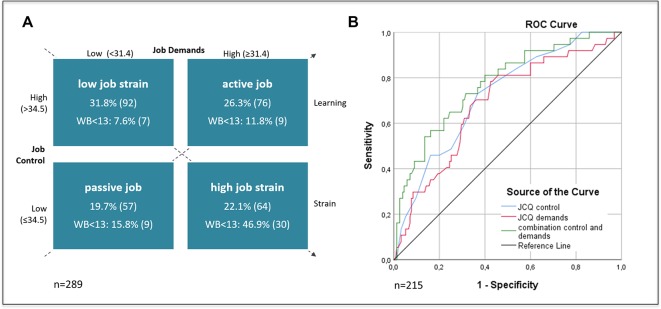
Figure 3.
(A) Classification in groups of job strain, according to Karasek35; valid per cent (n); subjects below the crucial cut-off of 13 for well-being (WB) for each pattern, valid per cent (n). (B) Receiver operating characteristic (ROC) curve in which the true-positive rate is plotted against the false-positive rate for job control, job demands and the combination of both (analysis in the trainings set; n=215).

