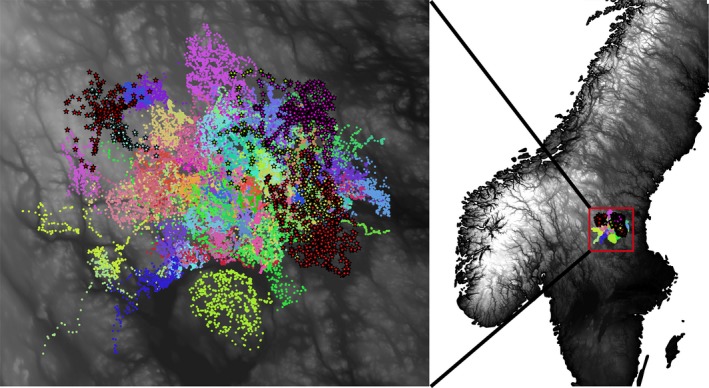
Figure 2.

Map of the study area in central Sweden. The elevational gradient is shaded from black (low elevation) to white (high elevation). GPS locations from brown bears (circles) and gray wolves (stars with black outline) are shown in different colors for each individual during the study period (2010–2015)
