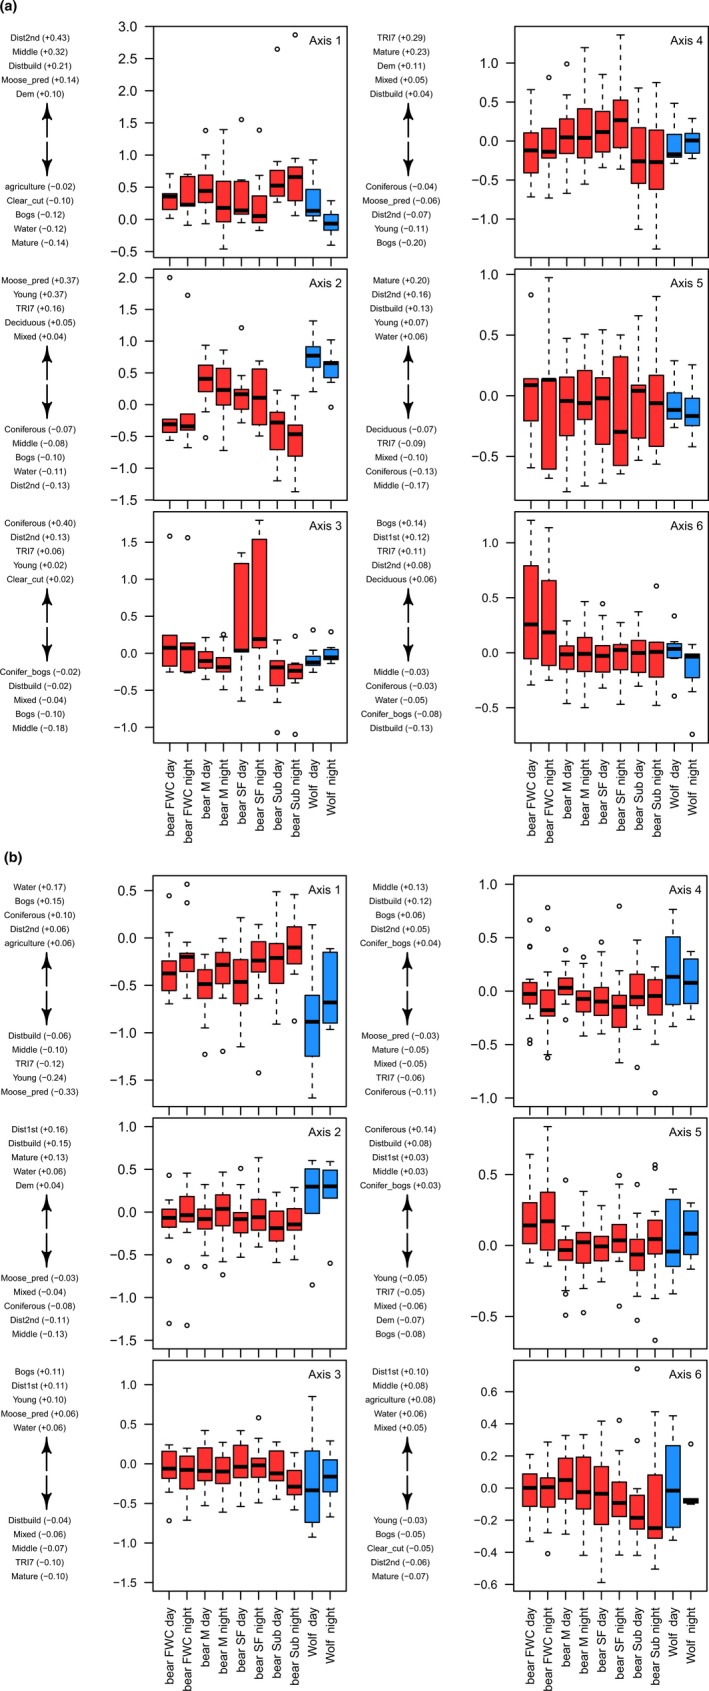
Figure 5.

Box plot of the K‐select analysis for habitat selection of gray wolves (blue) and brown bears (red) in central Sweden for the periods, (a) late‐winter period (1 March–30 April) and (b) spring (1 May–30 June). Box plots show marginality scores per species and reproductive status for axes 1–6 of the K‐select, respectively. The five variables contributing the most on each axis are shown on the left side of each box plot, with positive values above the arrow and negative values below the arrow. The scores of the five variables contributing the most are represented in brackets
