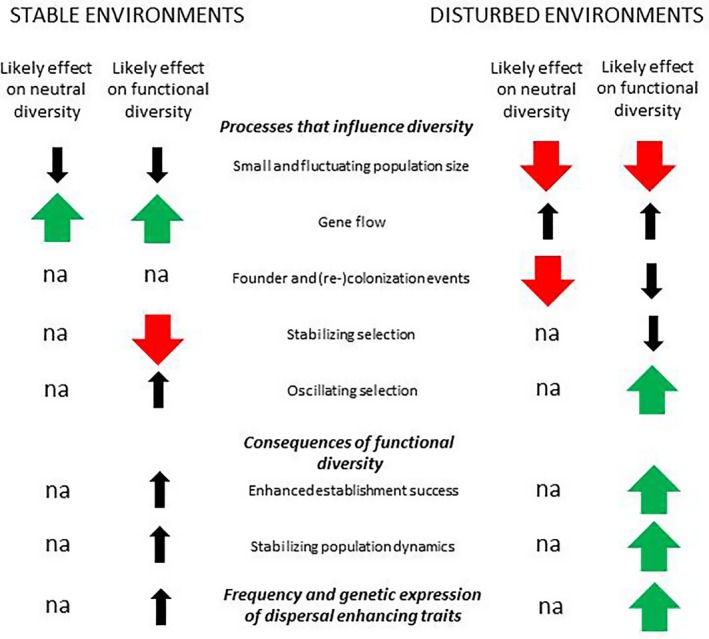
Figure 4.

A schematic illustration and summary of how random and deterministic processes differently influence neutral and functional genetic diversity of populations in stable and disturbed environments. Green (up) and red (down) thick arrows refer to positive and negative effects, respectively, and indicate that the magnitude of the effect is greater than in the other environmental disturbance regime. Black thin arrows indicate that the effects might be present albeit of relatively small magnitude compared with those indicated by red and green thick arrows. na indicates not applicable
