
Figure 4.
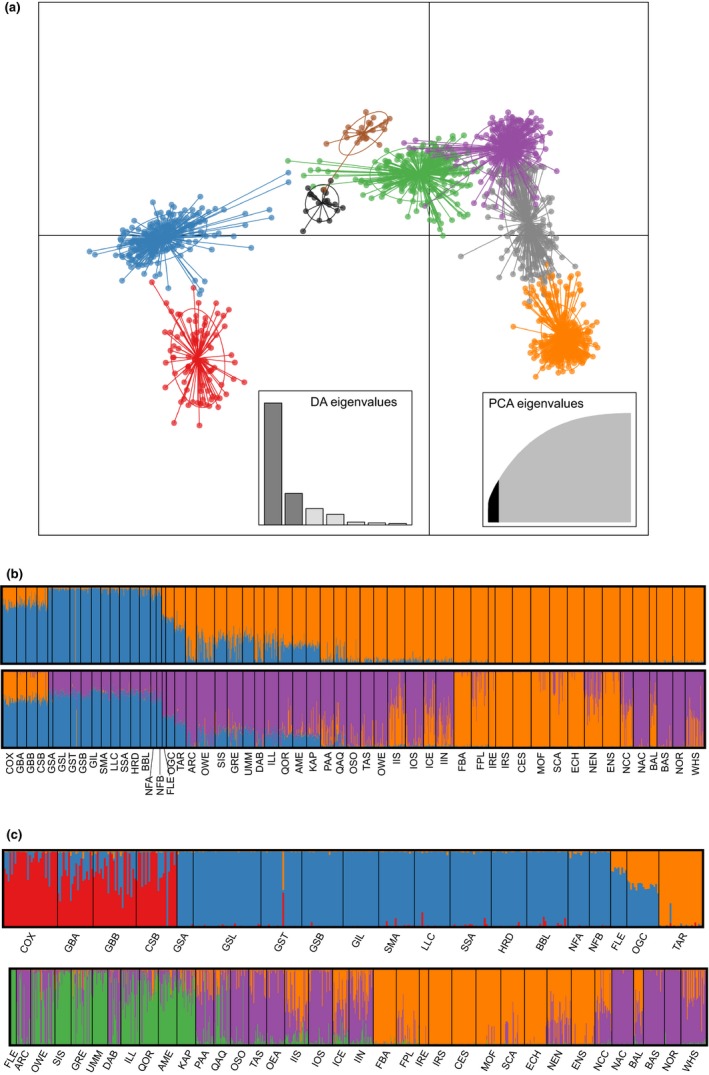
Analyses of population structure. a) Scatter plot of the first and second discriminant functions of DAPC analysis of 8 clusters delineated by the find.clusters function in ADEGENT. Clusters are approximately geographically representative and are color coded as RED = Gulf of Maine, BLUE = Atlantic Canada, GREEN = West Greenland, PURPLE = Offshore Europe, GRAY = northern Europe, ORANGE = southern Europe, BLACK = Ogac, and BROWN = Tariujarusiq. (b) Admixture plots from structure analysis showing all samples at K = 2 (top) and K = 3 (bottom). (c) Hierarchical structure analysis in North America (top) and Europe (bottom). Note that the Flemish Cap (FLE) is included in both hierarchal runs for comparison