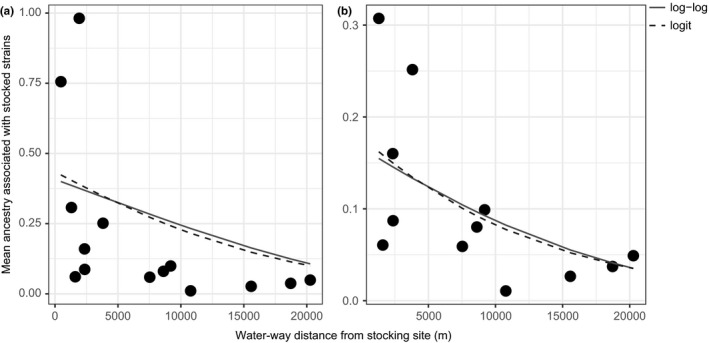
Figure 4.

Mean level of ancestry associated with stocked strains (see Figure 2) plotted against distance to the nearest proximal stocking site (see Figure 1) for (a) all sampling locations examined in this study, and (b) excluding outliers Huntley Pond Inlet and Blue Ledge Tributary. Points on the chart represent sampling locations, and the fitted curves correspond to beta regressions gy_loglog with log‐log link (solid) and gy_logit with logit link (dashed). Both treatments are statistically significant (a: p = 0.0047, pseudo R 2 = 0.34; b: p = 0.0137, pseudo R 2 = 0.39)
