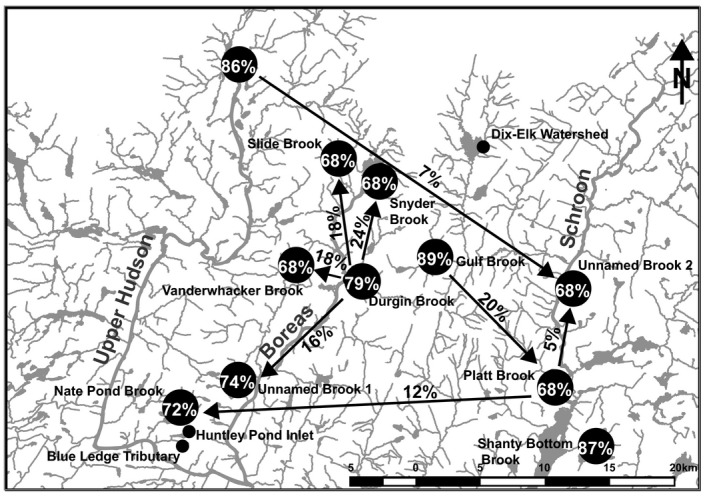
Figure 7.

Estimated migration between sampling sites. Numbers above arrows indicate the fraction of individuals from population (a) that are derived from population (b) (m), while numbers within the circles denote the proportion of nonimmigrants (NM) within populations. For clarity of presentation, M‐values <5% are not shown
