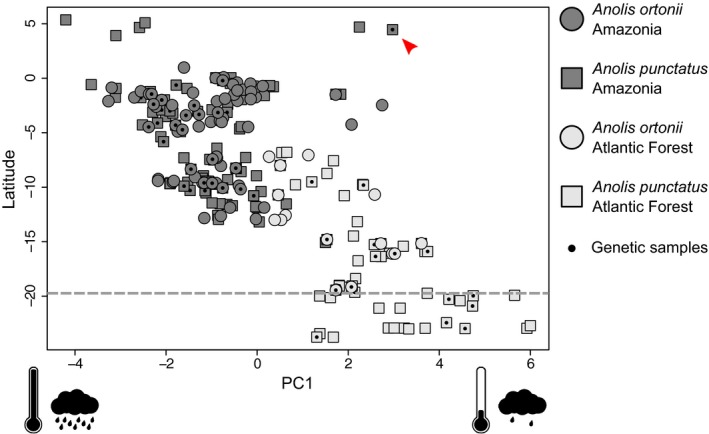
Figure 3.

Environmental space occupancy along latitude based on climatic PC1 for Anolis ortonii and A. punctatus. Samples used in genetic analyses are indicated with a black dot. Higher PC scores correspond to drier and colder sites. Dashed line indicates the approximate region of pronounced north–south climatic turnover in the Atlantic Forest as identified by Carnaval et al. (2014). Red arrow indicates A. punctatus sample MTR 20798 from Pacaraima, a mid‐elevation site (820 m above sea level) in the Guiana Shield region that overlaps climatically with Atlantic Forest sites (horizontal axis)
