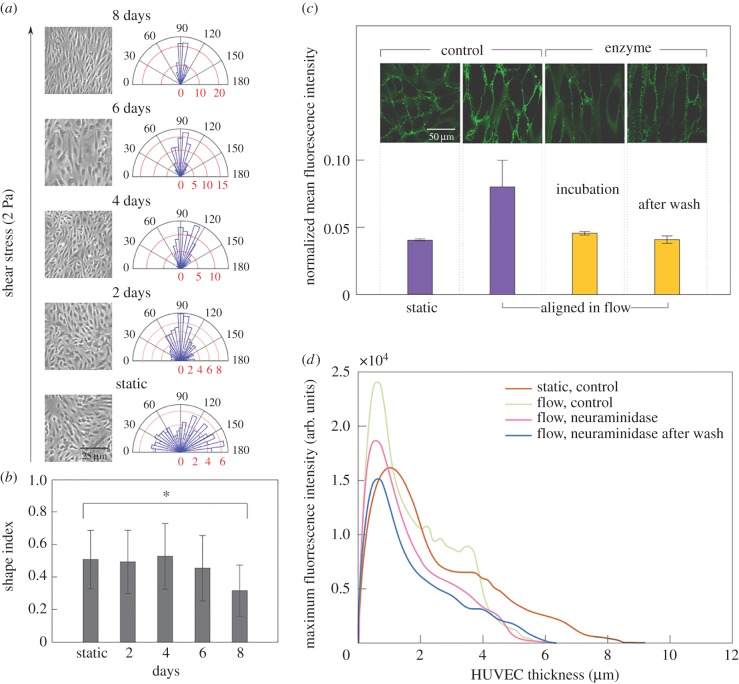
Figure 2.
Growth of HUVECs in microfluidic perfusion culture leads to a physiological endothelium as well as enabling in situ imaging of adhesion. The microscopy images of HUVECs in (a) illustrate progressive cell alignment under 2 Pa flow over 8 days, quantified in the polar plots. HUVECs orient along the flow direction (90°), the red axis indicates the percentage of HUVECs in a slice. In static conditions HUVECs are randomly orientated, while already after one day in flow, about 80% of cells are in the 60°–120° range, and after 8 days all cells show orientation angles within the 60°–120° range. HUVEC elongation quantified by shape index (SI) [49,50] after 8 days in flow (b). The SI is 1 for a circle and 0 for a straight line. At day 8 the difference from static is statistically significant (p < 0.001). Error bars (such as in the following figures) represent the standard deviation of the measurements. (c) The glycocalyx expression is quantified through fluorescent plasma membrane staining WGA from three different fields of view: fluorescence is doubled in aligned HUVECs, whereas it is comparable to the non-aligned cells during and after neuraminidase treatment of HUVECs. The glycocalyx component was inferred by the WGA mean fluorescence intensity that stains only the HUVEC glycocalyx, normalized by the confocal microscopy gain, in static, flow, during incubation with neuraminidase, and after neuraminidase treatment. (d) The thickness of HUVEC layer is reduced in flow conditions. The plots show the distribution of the WGA intensity used to highlight the HUVEC surface as a function of their thickness in static, flow, during incubation with neuraminidase, and after enzyme wash. HUVECs under flow have thickness of about 6 µm, with no significant difference before and after the neuraminidase treatment, whereas the thickness of HUVECs in static is about 9 µm. Z-stacks videos of HUVEC monolayer growth in different conditions in parallel channels were recorded from the level of the microscope slide upward with steps of 0.2 µm. The thickness was finally calculated from the reconstruction of the surface of the endothelial layer, in which each point is the maximum fluorescence intensity value of WGA dye used to mark the surface of HUVECs.

