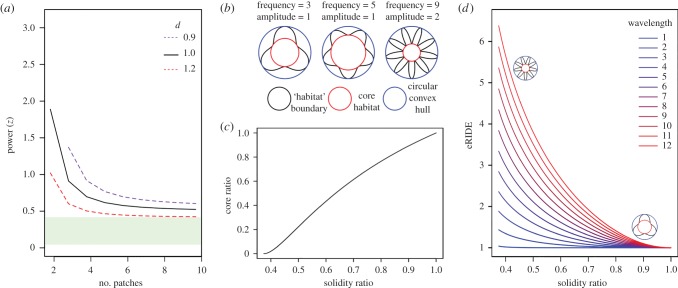
Figure 2.
Linking fragmentation effects to eRIDE. (a) Division effects. Lines display the SAR -z-value that balances both total biodiversity (ST, equation (2.4)) and eRIDE (R, equation (2.6), see electronic supplementary material, data S1) for different numbers of equally sized patches relative to a single habitat of the same shape. Conceptually, habitats obeying an SAR with values of z less than these values will have increased eRIDE with increased division. Dashed lines display the same z-value under the scenario where a dilution/amplification effect of magnituded alters the prevalence of disease relative to habitat biodiversity. The green shaded bar indicates the likely range of real-world values of z, based on the data in electronic supplementary material, table S1. (b,c,d) Geometric effects. (b) Schematic of de Broglie's circles with varying frequency and amplitude. (c) Correlation between solidity and core ratios for de Broglie's circles. (d) Correlation between eRIDE and solidity for de Broglie's circles of varying frequency and amplitude.

