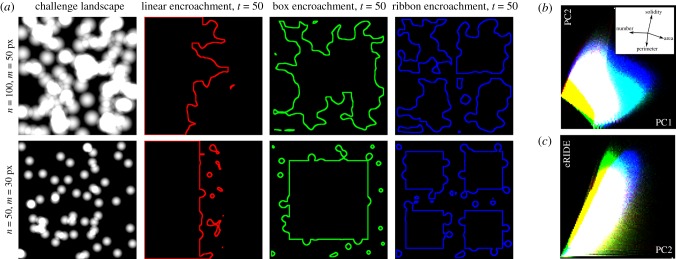
Figure 3.
Simulating habitat loss and fragmentation. (a) Snapshots of simulated landscapes. Depicted challenge landscapes were generated from n uniformly distributed spherical distributions with a radius of m pixels. Snapshots are taken half way through the simulated encroachment (t = 50 of 100), lines represent simulated habitat boundaries. (b) Heatmap of data from all simulated encroachment scenarios represented in the principal component axes one (PC1) and two (PC2), accounting for 51% and 37% of total variance, respectively. Inset: biplots of the influence of the contributing variables (number of patches, patch area, patch perimeter and patch solidity) to the arrangement of the principal components. (c) Heatmap depicting the correlation between PC2 and eRIDE in all simulated data, correlations between eRIDE and other principal components are displayed in electronic supplementary material, figure S4. Red, green and blue depict data from linear, box and ribbon encroachment models throughout.

