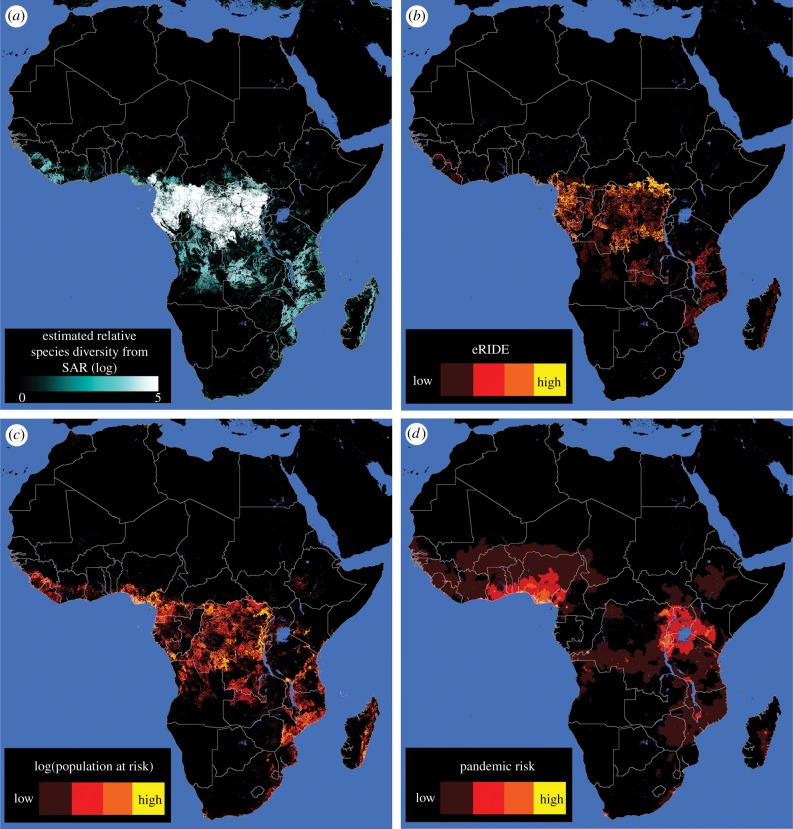
Figure 4.
Mapping spatial index estimates for African forests. Depicted are (a) estimated values of relative biodiversity, as inferred from forest patch areas and the species–area relationship (SAR), (b) eRIDE, (c) Population at risk (PAR, log values displayed for clarity) and (d) pandemic risk. Throughout, discrete colour bands increment following a log scale, one step per order of magnitude.

