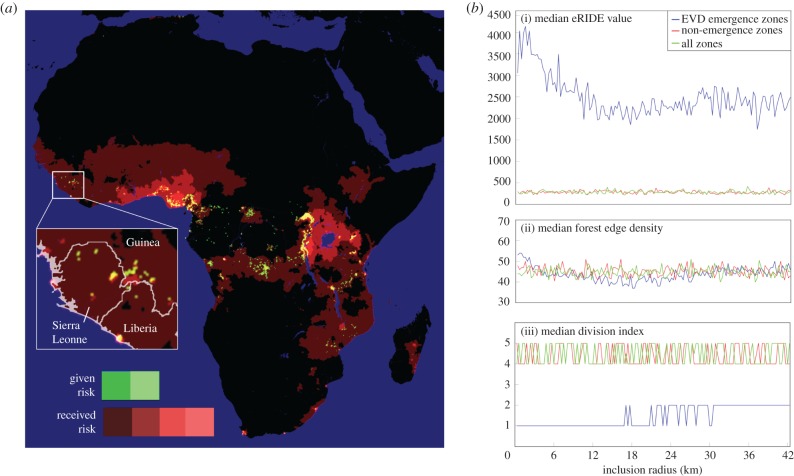
Figure 6.
Spatial index estimates for pandemic risk for African forests and the relationship with Ebola virus disease outbreaks. Relative pandemic risk, red tones depict areas estimated to be at the highest risk of pandemic. Green zones are graph nodes with the strongest influence on the total risk of pandemic spread. Both red and green luminosity increments following a log scale (one step per order of magnitude). Inset: magnification of the area affected by the 2014–2016 EVD outbreak in Western Africa. (b) Median values are presented for metrics of (i) eRIDE, (ii) forest edge density (number of edge pixels) and (iii) forest division (fragmentation per se, number of separated patches) with EVD outbreak zones (blue), outside of EVD outbreak zones (only non-zero pixels included, red) and randomly across both inside and outside of EVD outbreak zones (only non-zero pixels included, green). The inclusion radius denotes the area around the sites of known EVD outbreak index cases that was included in the EVD outbreak zones.

