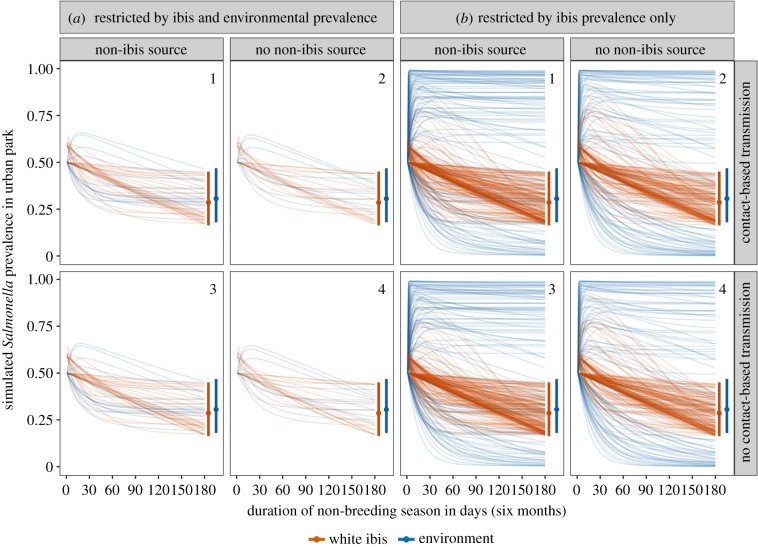
Figure 3.
Simulated Salmonella prevalence in ibis and the environment during the non-breeding season for parameter combinations retained from our LHS procedure. Lines show the simulated infection prevalence time series for ibis (orange) and the environment (blue) using plausible parameter combinations per model scenarios (indicated by 1–4). Rows show simulations where contact-based transmission was included (; top) or excluded (cf = 0; bottom). Columns show simulations where non-ibis sources of Salmonella were included (left in each panel; ψ ≥ 0) or excluded (right in each panel; ). Left pairs of columns show parameter combinations retained using field data on ibis and environmental prevalence (a), while right columns show those retained when only using ibis prevalence (b). Segments and points show observed prevalence and 95% confidence interval at the end of the 2015–2016 non-breeding season. (Online version in colour.)

