
Figure 4.
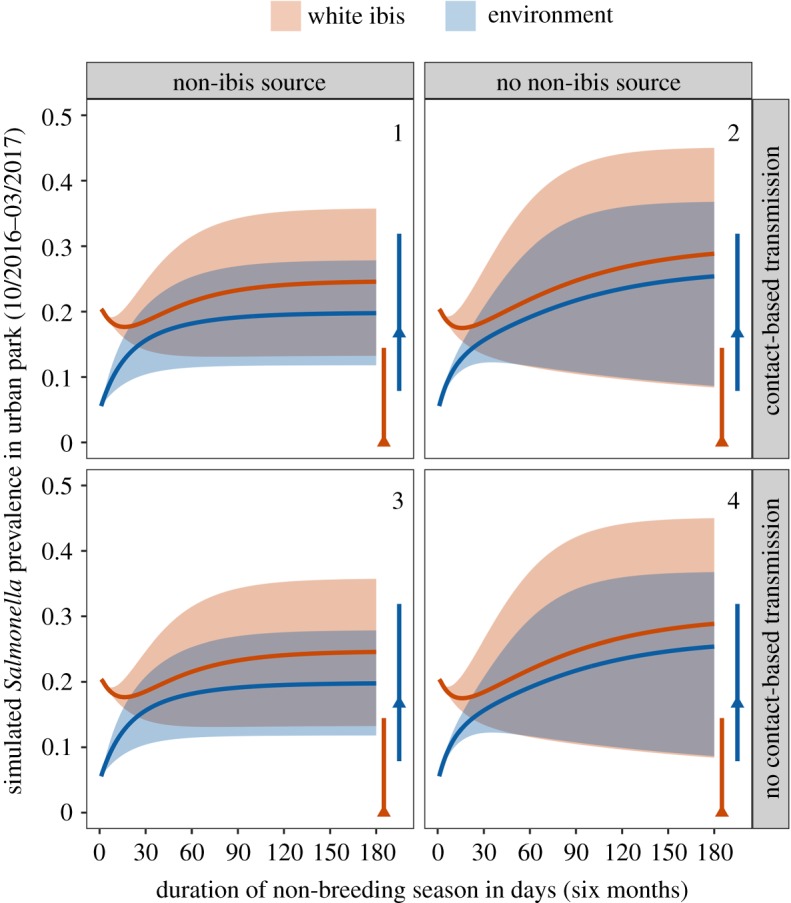
Validation of plausible parameters for each model scenario (indicated by 1–4) using mean flock size and initial conditions for autumn 2016. Lines show simulated infection prevalence time series for ibis (orange) and the environment (blue) using median values, while bands show the predictions generated using the standard error of these estimates. Rows show simulations where contact-based transmission was included (; top) or excluded (; bottom). Columns show simulations where non-ibis sources of Salmonella were included (left in each panel; ) or excluded (right in each panel; ). Segments and points show observed prevalence and 95% confidence interval at the end of the 2016–2017 non-breeding season. (Online version in colour.)