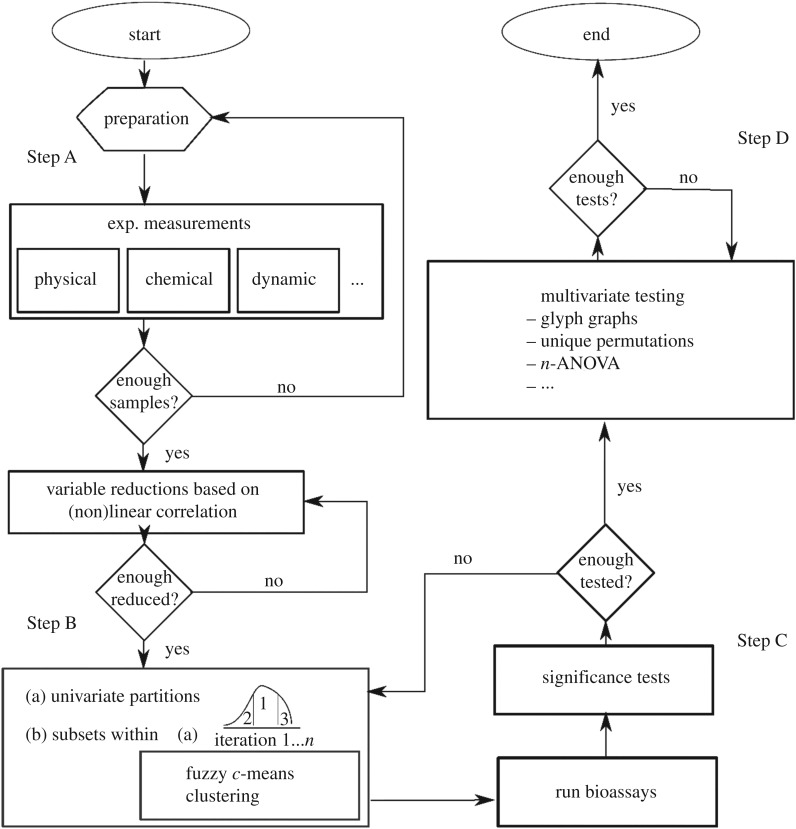
Figure 1.
Flow chart of the statistical approach. Step A: generation of populations of veneer discs, by experimentally identifying the maximum number of variables x1, x2, x3, …, xn, followed by a linear and a nonlinear correlation analysis to reduce the number of variables to a q-tupel of key material parameters; Step B: Generation of q univariate distributions, partitioned into lower bound (LB) and upper bound (UB) centre and extreme bands; application of the fuzzy c-means clustering algorithm [9]; Step C: Carrying out of bioassays and univariate analyses to determine main factors; Step D multivariate analyses.

