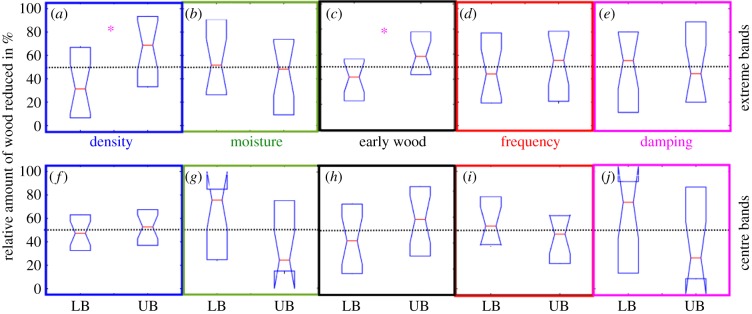
Figure 3.
Results of univariate analysis. Significantly different outcomes as detected by non-overlapping notches (95% confidence intervals, median test cf. Spanos [29]) between the LB and UB; significant are highlighted by asterisks (*). For (a–e) of the extreme band partitions, only the density shows significant differences (n = {20, 20, 19, 20, 20}). In the centre band partition (f–j), termites are indifferent to any given choice (n = {22, 15, 20, 16, 16}). (Online version in colour.)

