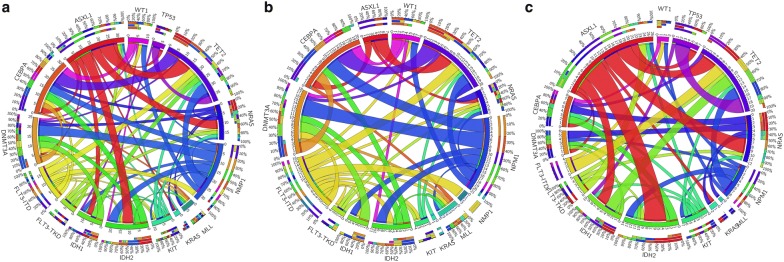
Fig. 1.
Circos plots depicting the relative frequencies and pairwise co-occurrences of selected common genetic alterations: in all AML patients (a), separately in patients 60 years or older (b) and in patients younger than 60 years (c). The length of the arc corresponds to the frequency of the first gene mutation, and the width of the ribbon corresponds to the proportion of co-occurrence with the second gene mutation. Both the distribution of gene mutations and the pattern of mutation co-occurrences appear to be distinct between older and younger AML patients

