Fig. 2.
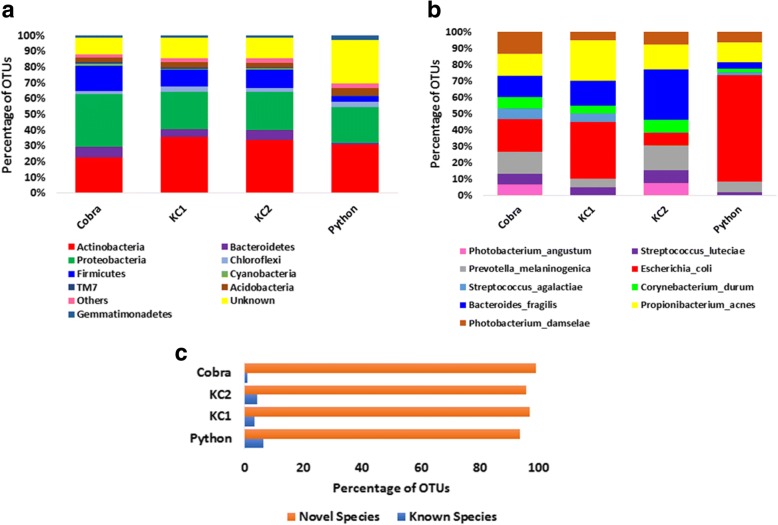
Taxonomy relative abundance plot of Cobra, King Cobra and Python oral samples. a The bar plot represents the relative OTU abundance of Cobra, King Cobra 1 (KC1), King Cobra 2 (KC2) and Python samples at the phylum level. In total, about 88% of OTUs were assigned to a known phylum while 12% of OTUs were designated as unknown. Actinobacteria and Proteobacteria were predominantly present in all the samples; b The bar plot shows percentage-wise relative OTU abundance at the species level. Escherichia coli, Bacteroides fragilis and Propionibacterium acnes were the most dominant species among the samples; c The plot shows the percentage of known and novel species identified after OUT-based clustering and annotation. Forty percent of the total OTUs were classified into a known genus. Likewise, 10% of OTUs were assigned a known species taxonomy classification. Here: novel species = unclassified or unknown species, known species = taxonomy information is available in the database

