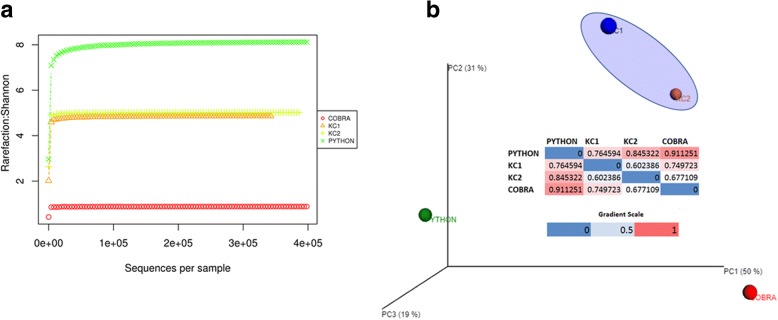
Fig. 4.
Alpha and beta diversity analysis of snake oral samples. a The rarefaction curve plotted using Shannon metrics to observe the species richness and evenness within the samples. The Shannon diversity index, estimated as 8.12 based on observed OTU abundances, indicates that the Python oral cavity (green asterisk) contains a higher number of species than the other samples; b Principal Coordinate Analysis of bacterial communities among the samples. The plot indicates that the King Cobra 1 and King Cobra 2 samples share a common taxon. Python and Cobra were uniquely distributed. All metrics were calculated using the software QIIME v1.8

