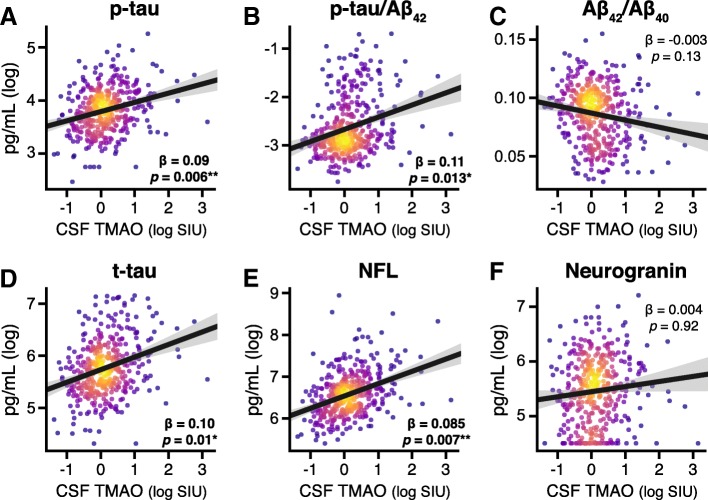
Fig. 2.
Relationship between CSF TMAO and CSF AD biomarkers (a–c) and biomarkers of neuronal degeneration (d–f). CSF TMAO is significantly positively correlated with phosphorylated tau (p-tau), p-tau/Aβ42, total tau (t-tau), and neurofilament light chain protein (NFL), after controlling for age and sex. Scatterplots show individual data points (n = 410) colored by 2D kernel density estimation. Hotter colors represent higher density; black line represents best linear fit between variables; shading represents 95% confidence interval of fit. CSF TMAO expressed as natural log-transformed scaled intensity units (SIU). Aβ, beta-amyloid CSF cerebrospinal fluid, TMAO trimethylamine N-oxide

