Fig. 1.

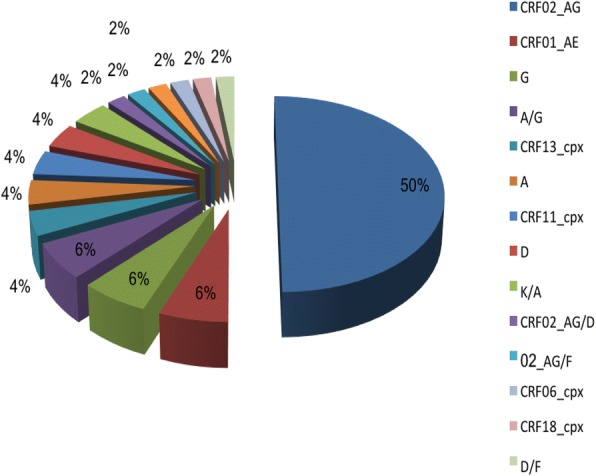
Distribution of HIV-1 Genetic variants. Each colour represents a HIV-1 genetic variant. The pie chart shows the proportion of each HIV-1 genetic variant identified in the study

Distribution of HIV-1 Genetic variants. Each colour represents a HIV-1 genetic variant. The pie chart shows the proportion of each HIV-1 genetic variant identified in the study