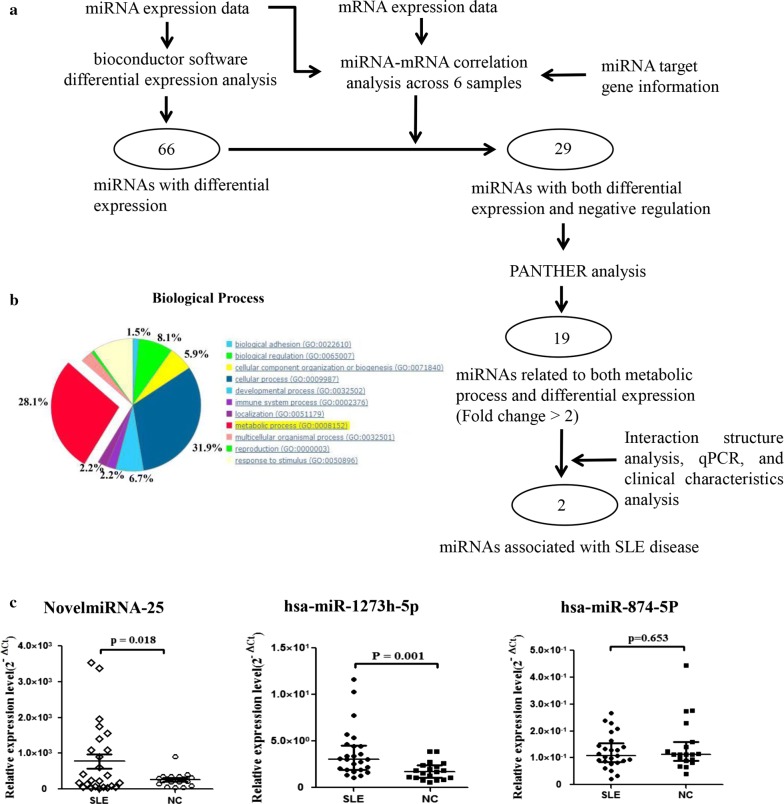
Fig. 3.
Construction of miRNA-target gene regulatory network and bioinformatic analysis. a Data analysis overview. miRNA and mRNA expression data were analyzed by Bioconductor for differential expression (fold change > 2 and P < 0.05). Combining these data and miRNA-target gene data, 29 miRNAs exhibiting both differential expression and negative regulation of target genes were selected. Next, PANTHER analysis facilitated the functional mapping of all 29 differentially expressed miRNAs to select 19 miRNAs related to metabolic processes. Finally, representative miRNAs and mRNAs were validated using qPCR and clinical characteristics. Integrating these results and interaction structure analysis, two miRNAs associated with SLE were selected. b Biological processes of the target genes of both differentially expressed and negatively regulated miRNAs. c Expression of candidate miRNAs in PBMCs of SLE patients and healthy controls. qRT-PCR was conducted on RNA samples from 25 SLE patients and 25 HCs. Data are presented as 2−ΔCt relative to U6 expression

