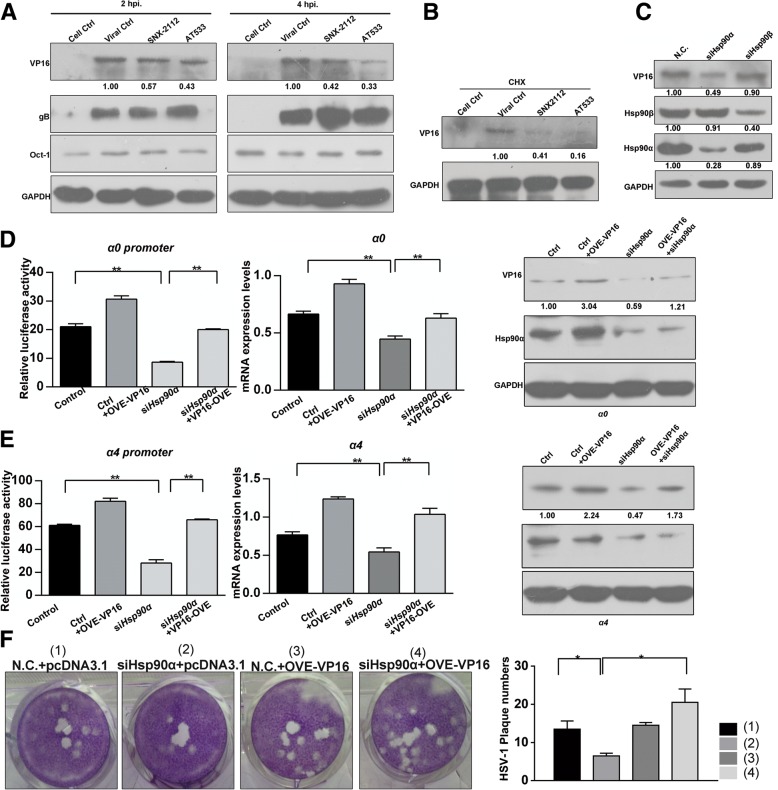
Fig. 2.
Hsp90α is required for the maintenance of the stability of VP16. a Hsp90 inhibition reduced VP16 protein levels in HSV-1-infected cells. Vero cells were infected with HSV-1 (MOI 50) for the indicated times in the presence of SNX-2112 (0.8 μM) or AT533 (2 μM), and total protein was extracted for western blot analysis to detect VP16 and gB. b Vero cells were infected with HSV-1 (MOI 50) in the presence of cycloheximide (100 μg/mL) and SNX-2112 (0.8 μM) or AT533 (2 μM), and protein was then extracted at 2 hpi for western blot analysis. c Hsp90α knockdown, but not Hsp90β knockdown, led to VP16 degradation. SH-SY5Y cells were transfected with siHsp90α-2 or siHsp90β (100 nM) for 24 h and then infected with HSV-1 (MOI 50) for 2 h. Protein samples were extracted and then subjected to western blot analysis. d VP16 restored the suppressed promoter activity of α0 and α4 genes induced by Hsp90α knockdown. Vero cells were cotransfected with siHsp90α-2 (100 nM) and the luciferase reporter plasmid as described in section 2.4 of the Materials and Methods. The cell lysates were subjected to luciferase activity assays (left panel) and analyzed by western blotting for detection of Hsp90α and VP16 (right panel). The results were provided as means ± SEM that calculated from three independent experiments. e Vero cells were cotransfected with siHsp90α-2 (100 nM) and pcDNA-VP16 plasmids (3 μg) for 48 h and then infected with HSV-1 (MOI 50) for 2 h. Total RNA was extracted for analysis of α0 and α4 RNA levels by qRT-PCR (left panel); Vero cells were cotransfected with siHsp90α-2 (100 nM) and pcDNA-VP16 plasmids (3 μg) for 48 h and then infected with HSV-1 (MOI 50) for 2 h. Total proteins were also extracted to detect VP16 and Hsp90α (right panel). f VP16 overexpression restored the reduction of HSV-1 infection mediated plaque formation that Hsp90α knockdown induced. Cells were infected with HSV-1 (MOI 0.1) for 2 h after co-transfection with siHsp90α-2 (100 nM) and pcDNA-VP16 plasmids (3 μg) and then subjected to plaque assays (left). Quantitative histograms were prepared (right)

